Note
Go to the end to download the full example code.
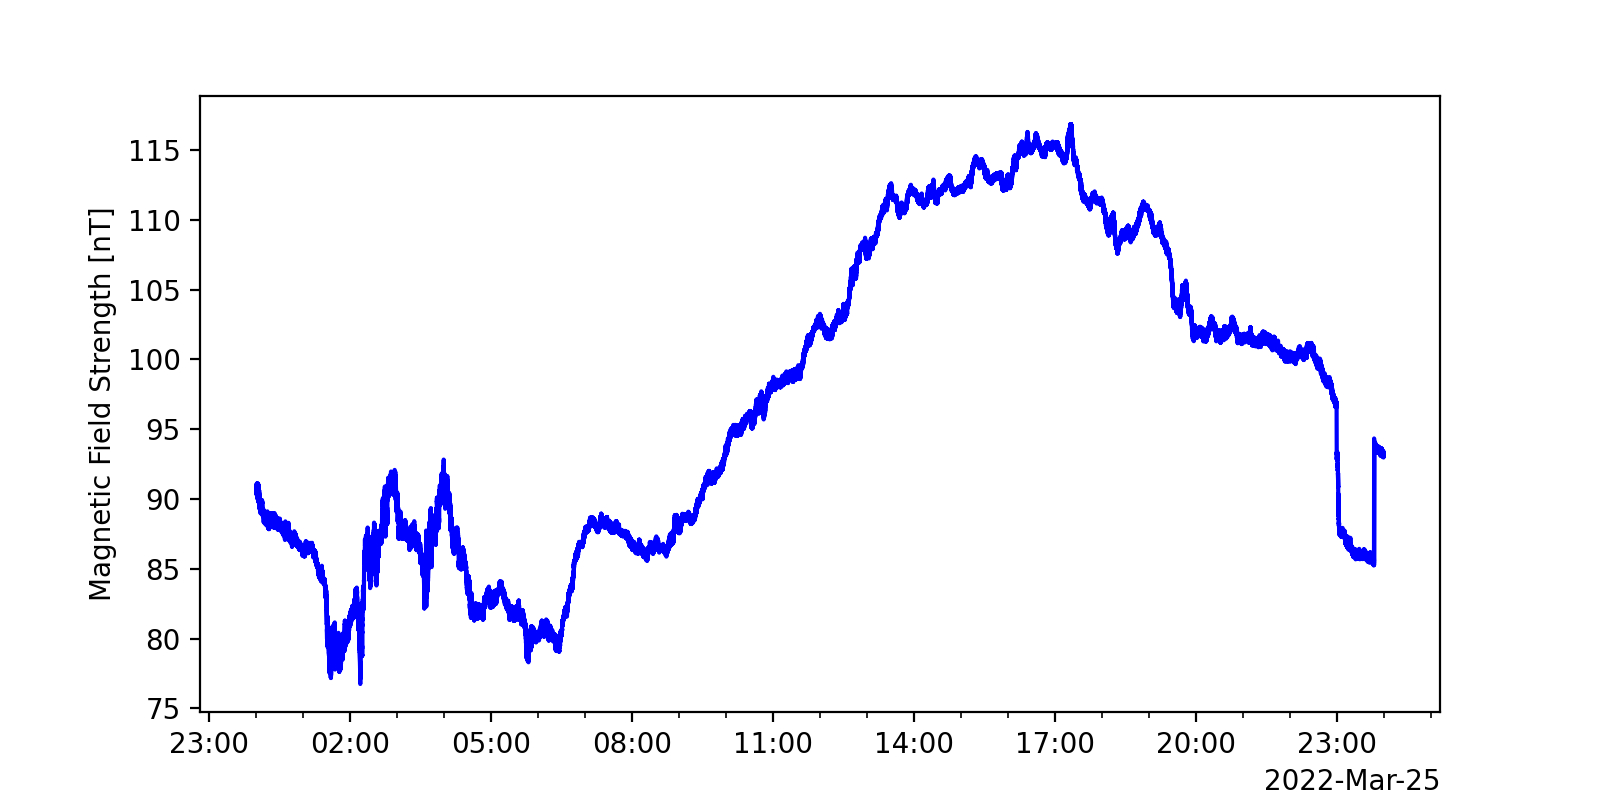
Plot High Resolution MAG Data
Download, read and plot high resolution (hires) GOES-R Series Magnetometer (MAG) data
import numpy as np
import matplotlib.pyplot as plt
import matplotlib.dates as mdates
import cftime
import netCDF4 as nc
import os, sys, requests
Download a day of GOES-16 data
dataurl = 'https://data.ngdc.noaa.gov/platforms/solar-space-observing-satellites/goes/goes16/l2/data/magn-l2-hires'
subdir = '/2022/03/'
filename = "dn_magn-l2-hires_g16_d20220325_v1-0-1.nc"

if not os.path.exists(filename):
    with open(filename, "wb") as f:
        url_path = dataurl+subdir+filename
        print(url_path)
        r = requests.get(url_path)
        print(r)
        f.write(r.content)
Read the magnetic field strength from the netCDF file
with nc.Dataset(filename) as ncf:

    dts = cftime.num2pydate(ncf.variables['time'][:],
                            ncf.variables['time'].units)

    B_total = ncf['b_total'][:]
Plot the data
f,ax = plt.subplots(1,1,figsize=(8,4),dpi=200)

ax.plot(dts,B_total,'b-')
ax.set_ylabel('Magnetic Field Strength [nT]')

#Format the times nicely
locator = mdates.HourLocator(interval=3)
ax.xaxis.set_major_locator(locator)
ax.xaxis.set_minor_locator(mdates.HourLocator())
ax.xaxis.set_major_formatter(mdates.ConciseDateFormatter(locator))

plt.show()
Total running time of the script: (0 minutes 2.040 seconds)