Note
Go to the end to download the full example code.
Plotting plasma waves with GOES-R MAG hires data
@author: alessandra.pacini
Import packages
import os, datetime
import netCDF4 as nc
from netCDF4 import Dataset
import cftime
import numpy as np
import datetime
import matplotlib
import matplotlib.pyplot as plt
import matplotlib.dates as mdates
from scipy import signal
import requests
Define functions
def j2000_sec_to_datetime( unix_ms ):
    dt0 = datetime.datetime( 2000, 1, 1,12)
    dt = np.array( [ dt0 + datetime.timedelta(seconds=unix_ms[i] ) \
                        for i in np.arange( len( unix_ms ) ) ] )
    return( dt )

def datetime_to_day( dt ):
    n_times = len( dt )
    t_diff = ( dt - dt[0])
    unix = np.array( [ ( (t_diff[i].microseconds \
                            + (t_diff[i].seconds \
                            + t_diff[i].days * 86400.) * 10.**6) / 10.**6 ) \
                        for i in np.arange( n_times ) ] )
    return unix

def timeTicks(x, pos):
    d = datetime.timedelta(seconds=x)
    hours, remainder = divmod(d.seconds, 3600)
    minutes, seconds = divmod(remainder, 60)
    duration_formatted = '{:d}:{:02d}:{:02d}'.format(hours, minutes,seconds)
    return duration_formatted

def format_time_axis(ax):
    locator = mdates.HourLocator(interval=1)
    ax.xaxis.set_major_locator(locator)
    ax.xaxis.set_minor_locator(mdates.HourLocator())
    ax.xaxis.set_major_formatter(mdates.ConciseDateFormatter(locator))

def butter_highpass(cutoff, fs, order):
    nyq = 0.5 * fs
    normal_cutoff = cutoff / nyq
    b, a = signal.butter(order, normal_cutoff, btype='high', analog=False)
    return b, a

def butter_highpass_filter(data,cutoff,fs,order=5):
    b,a = butter_highpass(cutoff,fs,order=order)
    data_filt = signal.lfilter(b,a,data)
    return data_filt
Download a day of GOES-16 10 Hz data
dataurl = 'https://data.ngdc.noaa.gov/platforms/solar-space-observing-satellites/goes/goes16/l2/data/magn-l2-hires'
subdir = '/2022/04/'
filename = "dn_magn-l2-hires_g16_d20220427_v1-0-1.nc"
if not os.path.exists(filename):
    with open(filename, "wb") as f:
        url_path = dataurl+subdir+filename
        print(url_path)
        r = requests.get(url_path)
        print(r)
        f.write(r.content)
Read MAG L2 hires data (in VDH), filtering and creating spectrograms
g16a = nc.Dataset(filename)

g16a.variables.keys()
VDH=g16a.variables['b_vdh'] #reading the B in VDH coordinates

TIME_UNITS = "seconds since 2000-01-01 12:00:00"

time=g16a.variables['time']
time=j2000_sec_to_datetime(time[:])
dt= datetime_to_day(time)
dts = cftime.num2pydate(g16a.variables['time'][:],g16a.variables['time'].units)

fs = 10 #sampling frequncy, Hz, usually 10 Hz for mag
cutoff=0.01 #cut off frequency
N = 1 #filter order
btype = 'high' #high or low pass filter
NFFT = 1024 #len of each fft segment
freqlim=1 # requency limit for plotting
db_min,db_max =-15, 20  #power level for plotting
str_plt, end_plt = 0, 1066 #start and end indexes for plotting, 0 and 1123 for full day

befilteredV=butter_highpass_filter(VDH[:,0], cutoff, fs, order=5)
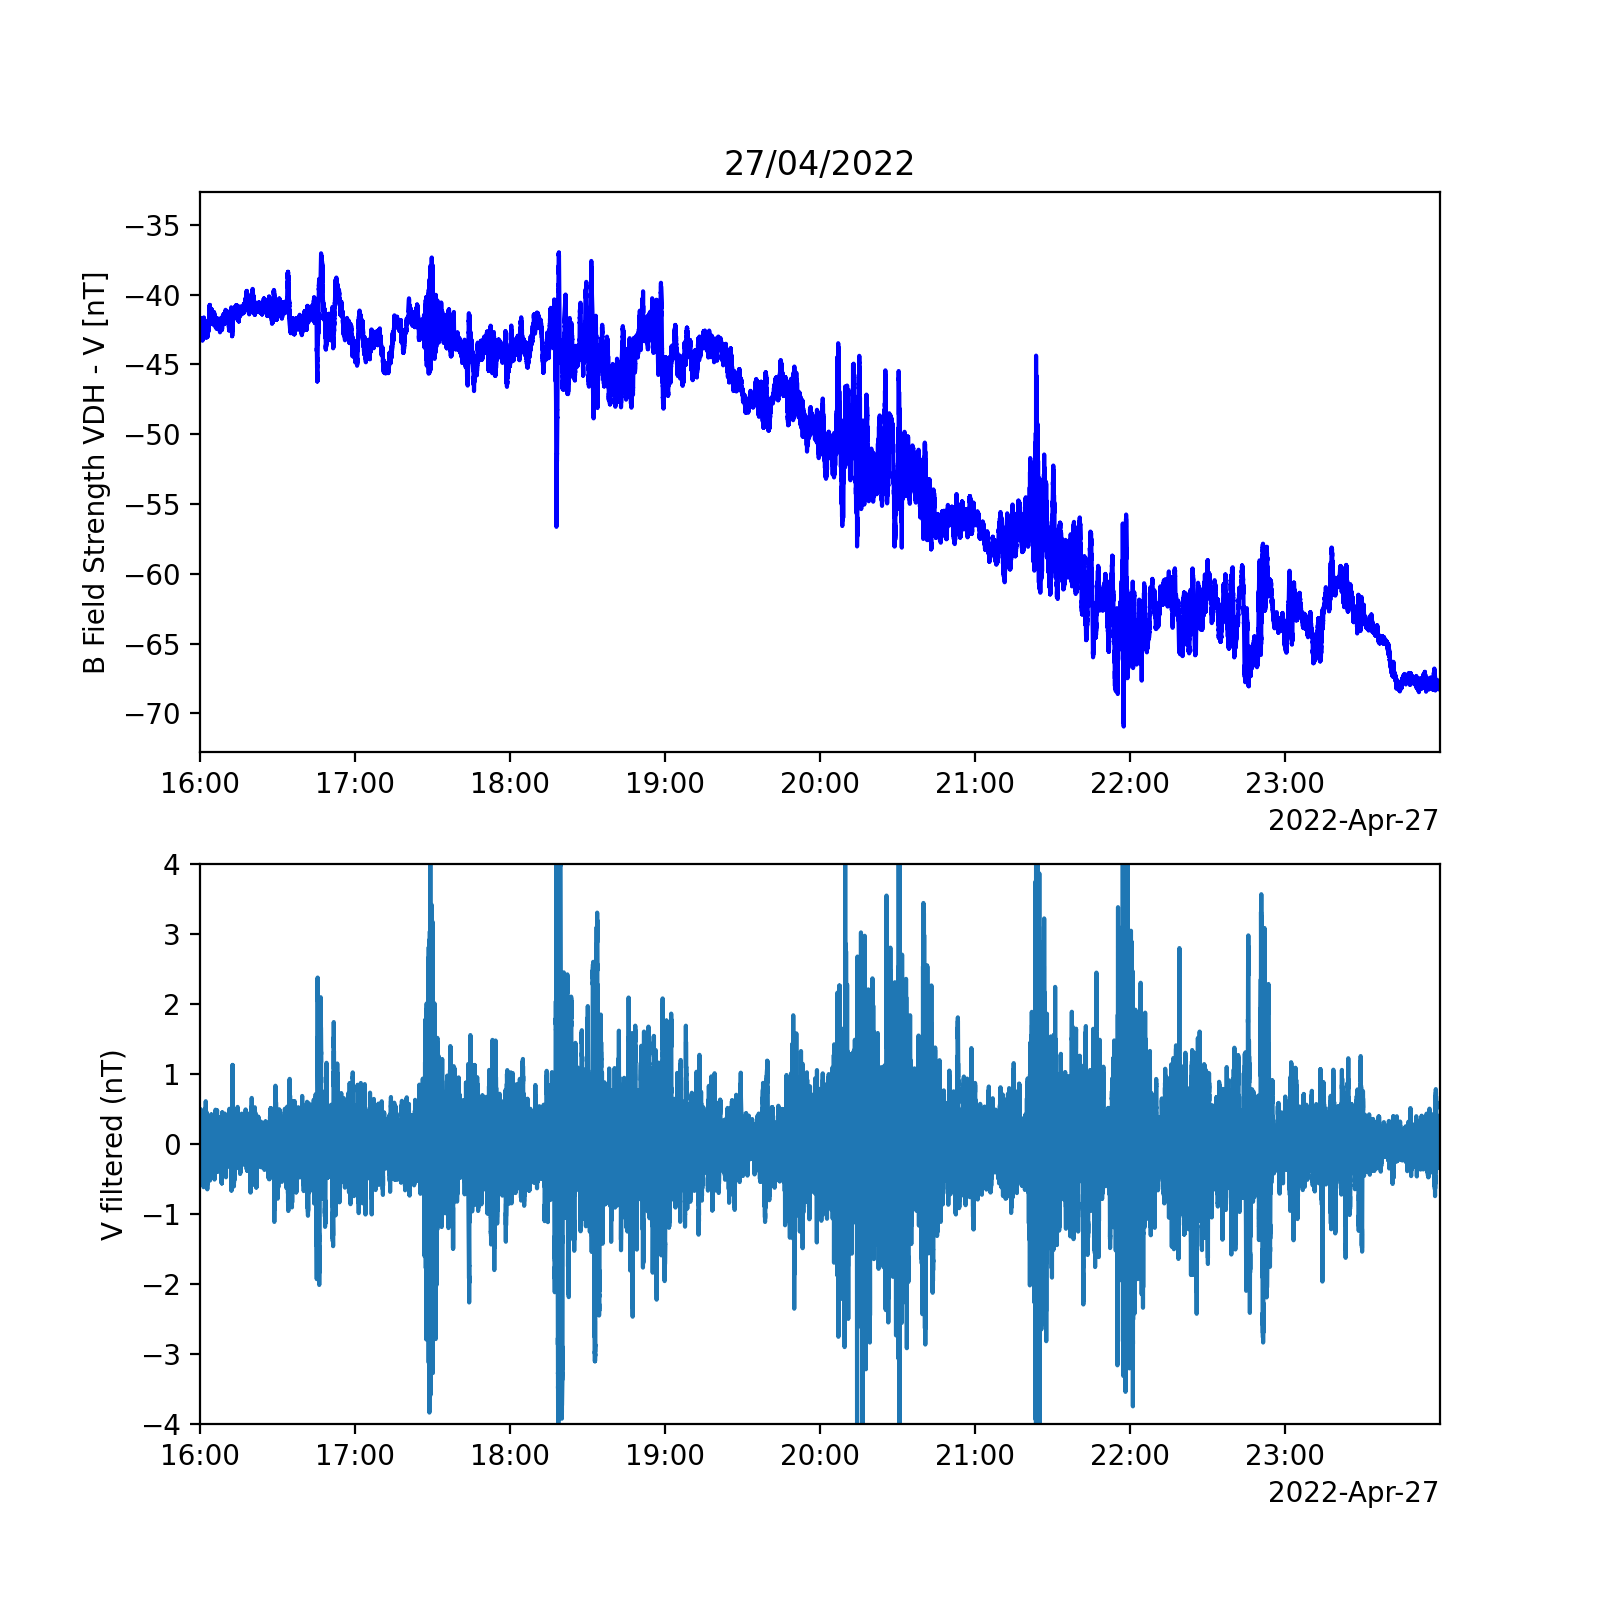
Plot the original data, filtered data, and spectrogram
f,axs = plt.subplots(2,1,figsize=(8,8),dpi=200)

axs[0].set_title('27/04/2022')
axs[0].plot(dts,VDH[:,0],'b-')
axs[0].set_ylabel('B Field Strength VDH - V [nT]')
axs[0].set_xlim(dts[576000],dts[-1])
format_time_axis(axs[0])

axs[1].plot(dts, befilteredV)
axs[1].set_ylabel("V filtered (nT)")
axs[1].set_ylim([-4,4])
axs[1].set_xlim(dts[576000],dts[-1])
format_time_axis(axs[1])

plt.show()

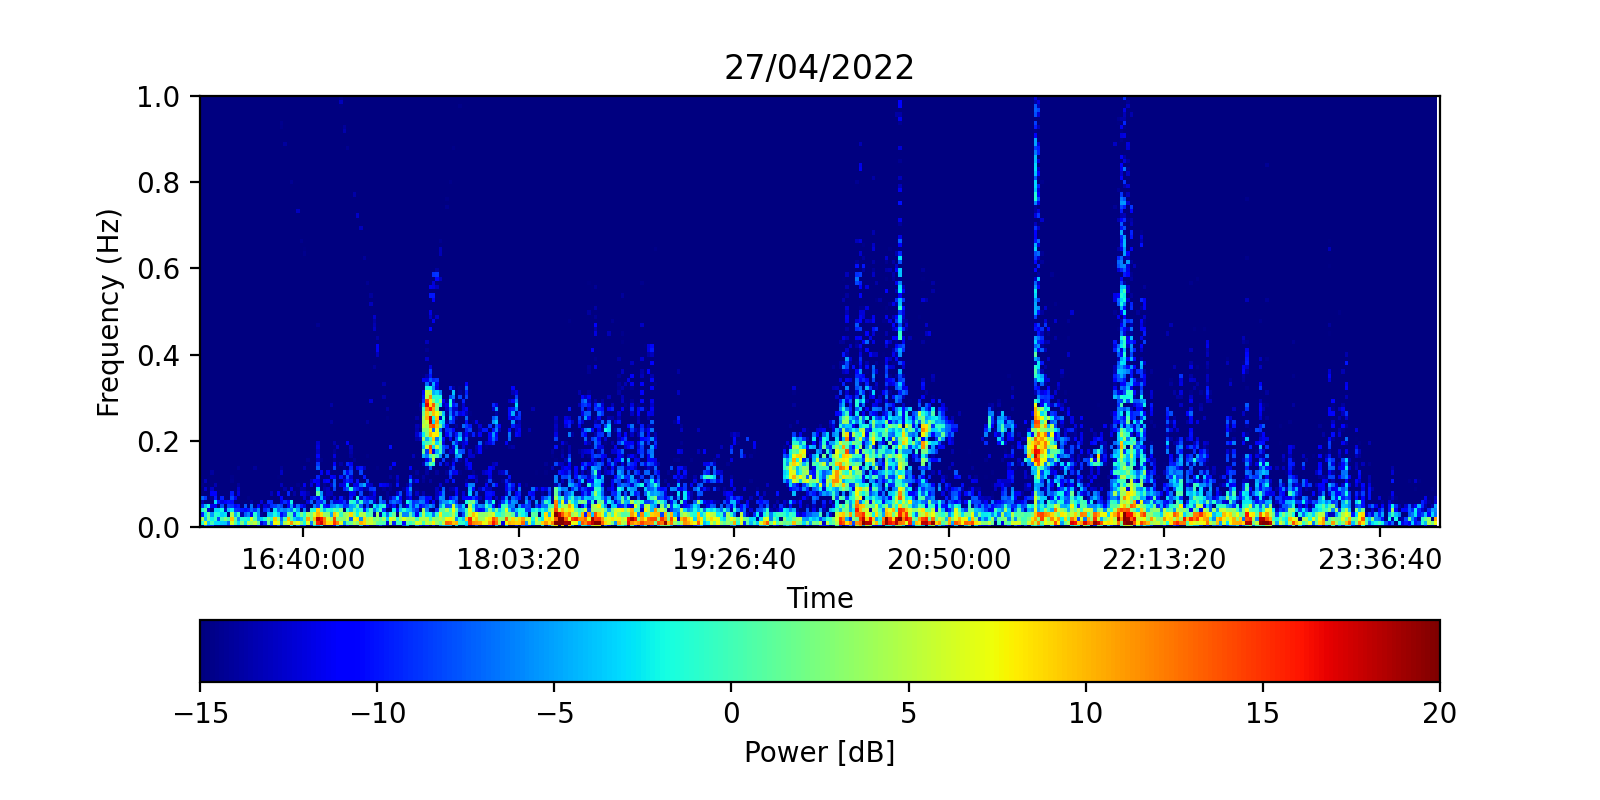
plt.subplots(1,1,figsize=(8,4),dpi=200)
plt.title('27/04/2022')
cmap =  plt.get_cmap('jet')
f, t, Sxx = signal.spectrogram(befilteredV, fs,
                                noverlap = NFFT / 4,
                                nperseg=NFFT,
                                detrend='linear')
sg_db = 10 * np.log10(Sxx)
plt.pcolormesh(t,f,sg_db, cmap=cmap, vmin=db_min, vmax=db_max)
plt.colorbar(orientation='horizontal',label='Power [dB]')
plt.ylim([0, freqlim])
plt.xlim(57600,86399)
plt.ylabel("Frequency (Hz)")
plt.xlabel("Time")
formatter = matplotlib.ticker.FuncFormatter(timeTicks)
plt.gca().xaxis.set_major_formatter(formatter)
plt.show()
Total running time of the script: (0 minutes 5.744 seconds)

