Note
Go to the end to download the full example code.
GOES-R EXIS Code: Plotting EUVS Irradiance and Quality Flags - Long Example
Jamie Mothersbaugh, University of Colorado CIRES and NOAA NCEI
This script demonstrates reading, analyzing and plotting the GOES-R EUVS irradiance and data quality flags. This example, using EUVS-A 30.4 nm irradiance, EUVS-B 121 nm irradiance, EUVS-C Mg II index data and EUV model spectrum irradiance shows how to read a NetCDF file, parse the irradiance and data quality flag variables, and display both the irradiance and flags in separate and combined plots.
First, several Python software libraries must be imported. These are used to read the EUVS NetCDF data files and manipulate the data in the files. Some syntax in this notebook is version-dependent. To view the version of each individual software package, run the following in a code cell: pip list
import netCDF4 as nc
import ncflag
# Import libraries to read the NetCDF data files and the data quality flags.

import numpy as np
# Import numpy.

import cftime
import datetime
# Import libraries used to read and plot the data timestamps.

import matplotlib.pyplot as plt
import matplotlib.dates as mdates
import matplotlib.ticker as tck
# Import matplotlib and specific libraries used for formatting the tick marks on the x-axis of the plots.

import requests
import os
from bs4 import BeautifulSoup
import glob
# Import libraries to download the data file.
Next, download the data file that is used in this code example. The file is downloaded to the current working directory; this is the same directory out of which this code is currently running.
local_directory = './'
euvs_filename = 'sci_euvs-l2-avg1m_g16_d20240918_v1-0-7.nc'
# Name of the EUVS file that is used in this notebook.

local_directory = './'
euvs_data_website = 'https://data.ngdc.noaa.gov/platforms/solar-space-observing-satellites/goes/goes16/l2/data/euvs-l2-avg1m_science' + \
                    '/2024/09/'
euvs_filename_prefix = 'sci_euvs-l2-avg1m_g16_d20240918_v'
local_file = glob.glob(local_directory + euvs_filename_prefix + '*.nc')
if local_file:
    print(os.path.basename(local_file[0]) + ' data file exists in local working directory')
    euvs_filename = os.path.basename(local_file[0])
else:
    print('A data file matching ' + euvs_filename_prefix + \
          '*nc does not exist in working directory; downloading file from the GOES 16-19 data website')
    url = requests.get(euvs_data_website)
    if url.status_code == 200:
        url_files = BeautifulSoup(url.text, 'html.parser')
        for link in url_files.find_all('a'):
            euvs_file = link.get('href')
            if euvs_file and euvs_file.startswith(euvs_filename_prefix) and euvs_file.endswith('.nc'):
                with open(local_directory + euvs_file, "wb") as f:
                    r = requests.get(euvs_data_website + euvs_file)
                    f.write(r.content)
                    euvs_filename = euvs_file
# Check if the EUVS data file exists in the local working directory. If the file does not exist in the local working directory, it will be downloaded to the local working directory from the GOES 16-19 space weather data website.
sci_euvs-l2-avg1m_g16_d20240918_v1-0-7.nc data file exists in local working directory
Finally, read in the EUVS data file. The file header and variable data descriptions can be printed out. These printouts contain important information about the contents of the data variables such as array size, values, types, etc.
euvs_data = nc.Dataset(local_directory + euvs_filename)
# Read in the EUVS data file.

print(euvs_data)
<class 'netCDF4.Dataset'>
root group (NETCDF4 data model, file format HDF5):
    Conventions: ACDD-1.3, Spase v2.2.6
    title: L2 EUVS 1 minute averages
    summary: The EXIS Extreme Ultraviolet Sensor (EUVS) measures seven line irradiances at extreme and far ultraviolet wavelengths as well as the Magnesium II index. This file contains measurements with a 1 minute average and associated flags.
    keywords: NumericalData.MeasurementType.Irradiance
    keywords_vocabulary: SPASE: Space Physics Archive Search and Extract Data Model version 2.2.6, GCMD: NASA Global Change Master Directory (GCMD) Earth Science Keywords version 8.5
    naming_authority: gov.nesdis.noaa
    history: See algorithm information.
    source: GOES-R EXIS/EUVS L1b
    processing_level: Level 2
    processing_level_description: Derived products
    license: These data may be redistributed and used without restriction.
    metadata_link:
    creator_name: NOAA NCEI STP Solar Irradiance Team
    creator_type: group
    creator_institution: DOC/NOAA/NESDIS/NCEI/COGS/GSDB/STP
    creator_email: goesr.exis@noaa.gov
    creator_url: https://www.ncei.noaa.gov/
    institution: DOC/NOAA/NESDIS
    publisher_name: National Centers for Environmental Information
    publisher_type: institution
    publisher_institution: DOC/NOAA/NESDIS/NCEI
    publisher_email: ncei.info@noaa.gov
    publisher_url: https://www.ncei.noaa.gov/
    references: GOES-R EUVS.03 Algorithm Theoretical Basis Document
    instrument: GOES R Series Extreme Ultraviolet Sensor and X-ray Irradiance Sensors (EXIS)
    instrument_id:
    program: Geostationary Operational Environmental Satellite, R-Series (GOES-R)
    project: Geostationary Operational Environmental Satellite R-Series (GOES-R) Core Ground Segment, Satellite Product Analysis and Distribution System (SPADES)
    time_coverage_resolution: PT1M
    processing_parameters_file:
    algorithm_parameters: None
    id: sci_euvs-l2-avg1m_g16_d20240918_v1-0-7.nc
    date_created: 2026-03-17T00:32:15.922Z
    orbital_slot: GOES-East
    platform: g16
    L1b_system_environment: SCI
    L1b_production_site: NCEI Boulder
    time_coverage_start: 2024-09-18T00:00:00.000Z
    time_coverage_end: 2024-09-19T00:00:00.000Z
    algorithm: euvs03_avg.py
    algorithm_version: [1 4]
    algorithm_date: 2022-10-12
    input_system_environments: sci
    input_files_first: sci_exis-l1b-sfeu_g16_d20240918_v1-0-5.nc
    input_files_last: sci_exis-l1b-sfeu_g16_d20240918_v1-0-5.nc
    input_files_total: 1
    git_commit_hash: 643f1ef427e2c80aa118df5c6fd647c7fed90dd3
    git_commit_date: 2026-03-08T19:06:02
    L1b_LUT_Filenames: EUVSA_Cal_INR(fm1_CDRL79revW_tdep).h5 EUVSB_Cal_INR(fm1_CDRL79revW_tdep).h5 EUVSC_Cal_INR(fm1_CDRL79revW_tdep).h5 EUVSPEC_Cal_INR_(fm1_CDRL79revJ_tdep).h5 Yearly_1AU_Correction_Table(2024)-757339200.0.h5
    dimensions(sizes): time(1440), lines(7), bounds(2), wavelength_bin(23)
    variables(dimensions): float64 time(time), float32 irr_256(time), float32 irr_284(time), float32 irr_304(time), float32 irr_1175(time), float32 irr_1216(time), float32 irr_1335(time), float32 irr_1405(time), float32 MgII_EXIS(time), float32 MgII_standard(time), uint8 irr_256_flag(time), uint8 irr_284_flag(time), uint8 irr_304_flag(time), uint8 irr_1175_flag(time), uint8 irr_1216_flag(time), uint8 irr_1335_flag(time), uint8 irr_1405_flag(time), uint8 MgII_flag(time), uint8 irr_256_flag_excluded(time), uint8 irr_284_flag_excluded(time), uint8 irr_304_flag_excluded(time), uint8 irr_1175_flag_excluded(time), uint8 irr_1216_flag_excluded(time), uint8 irr_1335_flag_excluded(time), uint8 irr_1405_flag_excluded(time), uint8 MgII_flag_excluded(time), uint8 irr_256_num(time), uint8 irr_284_num(time), uint8 irr_304_num(time), uint8 irr_1175_num(time), uint8 irr_1216_num(time), uint8 irr_1335_num(time), uint8 irr_1405_num(time), uint8 MgII_num(time), uint8 EUVS_C_active_channel(time), float32 au_factor(time), uint8 geocorona_flag(time), float32 wavelength_bounds(lines, bounds), float32 wavelength_lines(lines), float32 irr_284_1nm(time), float32 irr_304_1nm(time), float32 irr_1216_1nm(time), uint8 yaw_flip_flag(time), float32 model_wavelength_bounds(wavelength_bin, bounds), float32 model_irradiance_spectrum(time, wavelength_bin), uint8 model_case_flag(time)
    groups:
EUVS-A Irradiance Print the irradiance and quality flag variable summaries for the EUVS-A 30.4 nm data. The variables in the NetCDF file are accessed with the following syntax: file_variable[“variable_name”].
print(euvs_data["irr_304"])
<class 'netCDF4.Variable'>
float32 irr_304(time)
    long_name: Average irradiance for 30.4-nm line.
    units: W/m2
    _FillValue: -9999.0
    valid_min: 0.0002
    valid_max: 0.012
unlimited dimensions: time
current shape = (1440,)
filling off
The timestamps in the data file are in units of seconds since 12:00:00 UTC on January 1 2000. The Python function num2pydate, part of the cftime library, converts the timestamps from these units to datetime objects that are in YYYY-MoMo-DD-HH-MinMin-SS format.
euvs_timestamps = cftime.num2pydate(euvs_data["time"][:], euvs_data["time"].units)
# Convert timestamps to datetime objects.
The 30.4 nm line will be used to demonstrate the EUVS-A data. This is the brightest EUVS-A line. The data quality flags are extracted using the ncflag library (https://github.com/5tefan/ncflag).
The quality flags are read from the “irr_304_flag” NetCDF variable using ncflag.FlagWrap.
euvsa_flags = ncflag.FlagWrap.init_from_netcdf(euvs_data["irr_304_flag"])
print(euvsa_flags.flag_meanings)
print(euvs_data["irr_304_flag"].flag_values)
['good_quality', 'eclipse', 'lunar_transit', 'bad_or_no_data']
[0 1 2 4]
There are 4 quality flags in the data, each with a corresponding bit value. The euvsa_flags object can be indexed to determine the indices at which each flag is set. This then allows for flagged data to be included or excluded from plotting and analysis.
The ncflag.get_flag() function is used to find the flags set at each index. The code below loops over each of the values (flag names) in the euvsa_flags.flag_meanings array. The get_flag() function analyzes the bit values set at each index to determine which flags are set.
A bit value of 0 means only the ‘good_quality’ flag is set. A bit value of 1 means only the ‘eclipse’ flag is set. A bit value of 6 means the ‘eclipse’ and ‘bad_or_no_data’ flags are set. And so on.
print('Number of indices at which the EUVSA quality flags are set:')
for i in euvsa_flags.flag_meanings:
# Loop over all indices in the flag_meanings array of the euvsa_flags object.

    flag_set = euvsa_flags.get_flag(i)
    # Determine indices where the current flag is and is not set. Every index is assigned a Boolean value:
    # True means the flag is set, False means the flag is not set.

    flag_frequency = np.count_nonzero(flag_set)
    print(f"{i:<14}: {flag_frequency}")
    # Print the number of indices at which each flag is set.
Number of indices at which the EUVSA quality flags are set:
good_quality  : 1342
eclipse       : 28
lunar_transit : 0
bad_or_no_data: 70
There is no lunar transit on this day, but the ‘eclipse’ and ‘bad_or_no_data’ flags indicate there is an eclipse on this day.
# The geostationary orbit of the GOES satellites means they experience 2 eclipse seasons, centered on the spring and fall equinoxes, each year. The spring eclipse season starts at the end of February, peaks in the middle of March and ends in early April. The fall eclipse season starts at the end of August, peaks in the middle of September and ends in early October. As seen by the satellite, the Earth eclipses the Sun each day during the eclipse season. The longest eclipse is 70 minutes.
The first and last days of the eclipse season can cause penumbra-only eclipses. During these events, the satellite is in the penumbra shadow of the eclipse, but not the umbra. The Sun is still partially visible, causing a dip in the irradiance as a function of time.
The loop above can be separated to save arrays of the Boolean values for each flag.
good_quality_flag = euvsa_flags.get_flag('good_quality')
eclipse_flag = euvsa_flags.get_flag('eclipse')
lunar_transit = euvsa_flags.get_flag('lunar_transit')
bad_flag = euvsa_flags.get_flag('bad_or_no_data')
# Arrays with True/False values indicating the indices at which each flag is set and not set.
These arrays can now be used to determine the timestamps at which each flag is set.
good_timestamps = euvs_timestamps[good_quality_flag]
eclipse_timestamps = euvs_timestamps[eclipse_flag]
lunar_transit_timestamps = euvs_timestamps[lunar_transit]
bad_timestamps = euvs_timestamps[bad_flag]
# Extract the timestamps at which each flag is set.

print('The "good_quality" flag is set at the following timestamps: ' + str(good_timestamps))
print('')
print('The "eclipse" flag is set at the following timestamps: ' + str(eclipse_timestamps))
print('')
print('The "lunar_transit" flag is set at the following timestamps: ' + str(lunar_transit_timestamps))
print('')
print('The "bad_or_no_data" flag is set at the following timestamps: ' + str(bad_timestamps))
The "good_quality" flag is set at the following timestamps: [real_datetime(2024, 9, 18, 0, 0) real_datetime(2024, 9, 18, 0, 1)
 real_datetime(2024, 9, 18, 0, 2) ... real_datetime(2024, 9, 18, 23, 57)
 real_datetime(2024, 9, 18, 23, 58) real_datetime(2024, 9, 18, 23, 59)]

The "eclipse" flag is set at the following timestamps: [real_datetime(2024, 9, 18, 4, 11) real_datetime(2024, 9, 18, 4, 12)
 real_datetime(2024, 9, 18, 4, 13) real_datetime(2024, 9, 18, 4, 14)
 real_datetime(2024, 9, 18, 4, 15) real_datetime(2024, 9, 18, 4, 16)
 real_datetime(2024, 9, 18, 4, 17) real_datetime(2024, 9, 18, 4, 18)
 real_datetime(2024, 9, 18, 4, 19) real_datetime(2024, 9, 18, 4, 20)
 real_datetime(2024, 9, 18, 4, 34) real_datetime(2024, 9, 18, 4, 39)
 real_datetime(2024, 9, 18, 4, 43) real_datetime(2024, 9, 18, 4, 53)
 real_datetime(2024, 9, 18, 4, 54) real_datetime(2024, 9, 18, 5, 2)
 real_datetime(2024, 9, 18, 5, 4) real_datetime(2024, 9, 18, 5, 12)
 real_datetime(2024, 9, 18, 5, 19) real_datetime(2024, 9, 18, 5, 29)
 real_datetime(2024, 9, 18, 5, 30) real_datetime(2024, 9, 18, 5, 31)
 real_datetime(2024, 9, 18, 5, 32) real_datetime(2024, 9, 18, 5, 33)
 real_datetime(2024, 9, 18, 5, 34) real_datetime(2024, 9, 18, 5, 35)
 real_datetime(2024, 9, 18, 5, 36) real_datetime(2024, 9, 18, 5, 37)]

The "lunar_transit" flag is set at the following timestamps: []

The "bad_or_no_data" flag is set at the following timestamps: [real_datetime(2024, 9, 18, 1, 26) real_datetime(2024, 9, 18, 1, 27)
 real_datetime(2024, 9, 18, 1, 32) real_datetime(2024, 9, 18, 1, 33)
 real_datetime(2024, 9, 18, 1, 48) real_datetime(2024, 9, 18, 1, 49)
 real_datetime(2024, 9, 18, 1, 52) real_datetime(2024, 9, 18, 1, 53)
 real_datetime(2024, 9, 18, 4, 21) real_datetime(2024, 9, 18, 4, 22)
 real_datetime(2024, 9, 18, 4, 23) real_datetime(2024, 9, 18, 4, 24)
 real_datetime(2024, 9, 18, 4, 25) real_datetime(2024, 9, 18, 4, 26)
 real_datetime(2024, 9, 18, 4, 27) real_datetime(2024, 9, 18, 4, 28)
 real_datetime(2024, 9, 18, 4, 29) real_datetime(2024, 9, 18, 4, 30)
 real_datetime(2024, 9, 18, 4, 31) real_datetime(2024, 9, 18, 4, 32)
 real_datetime(2024, 9, 18, 4, 33) real_datetime(2024, 9, 18, 4, 35)
 real_datetime(2024, 9, 18, 4, 36) real_datetime(2024, 9, 18, 4, 37)
 real_datetime(2024, 9, 18, 4, 38) real_datetime(2024, 9, 18, 4, 40)
 real_datetime(2024, 9, 18, 4, 41) real_datetime(2024, 9, 18, 4, 42)
 real_datetime(2024, 9, 18, 4, 44) real_datetime(2024, 9, 18, 4, 45)
 real_datetime(2024, 9, 18, 4, 46) real_datetime(2024, 9, 18, 4, 47)
 real_datetime(2024, 9, 18, 4, 48) real_datetime(2024, 9, 18, 4, 49)
 real_datetime(2024, 9, 18, 4, 50) real_datetime(2024, 9, 18, 4, 51)
 real_datetime(2024, 9, 18, 4, 52) real_datetime(2024, 9, 18, 4, 55)
 real_datetime(2024, 9, 18, 4, 56) real_datetime(2024, 9, 18, 4, 57)
 real_datetime(2024, 9, 18, 4, 58) real_datetime(2024, 9, 18, 4, 59)
 real_datetime(2024, 9, 18, 5, 0) real_datetime(2024, 9, 18, 5, 1)
 real_datetime(2024, 9, 18, 5, 3) real_datetime(2024, 9, 18, 5, 5)
 real_datetime(2024, 9, 18, 5, 6) real_datetime(2024, 9, 18, 5, 7)
 real_datetime(2024, 9, 18, 5, 8) real_datetime(2024, 9, 18, 5, 9)
 real_datetime(2024, 9, 18, 5, 10) real_datetime(2024, 9, 18, 5, 11)
 real_datetime(2024, 9, 18, 5, 13) real_datetime(2024, 9, 18, 5, 14)
 real_datetime(2024, 9, 18, 5, 15) real_datetime(2024, 9, 18, 5, 16)
 real_datetime(2024, 9, 18, 5, 17) real_datetime(2024, 9, 18, 5, 18)
 real_datetime(2024, 9, 18, 5, 20) real_datetime(2024, 9, 18, 5, 21)
 real_datetime(2024, 9, 18, 5, 22) real_datetime(2024, 9, 18, 5, 23)
 real_datetime(2024, 9, 18, 5, 24) real_datetime(2024, 9, 18, 5, 25)
 real_datetime(2024, 9, 18, 5, 26) real_datetime(2024, 9, 18, 5, 27)
 real_datetime(2024, 9, 18, 5, 28) real_datetime(2024, 9, 18, 16, 17)
 real_datetime(2024, 9, 18, 16, 18) real_datetime(2024, 9, 18, 21, 51)]
As expected, the ‘lunar_transit’ flag is not set at any timestamps.
The ‘eclipse’ flag is set at 2 time ranges: 04:13-04:20 and 05:28-05:37.
The ‘bad_or_no_data’ flag is set at 3 time ranges: 01:32-01:53, 04:21-05:27 and 16:17-16:18.
The flags set from 04:13-05:37 indicate there is an eclipse on this day. This is expected, since the date of the file (September 18) is near the peak of the fall eclipse season. The eclipse will be further explored when plotting the irradiance.
Now the irradiance can be plotted. First, make a plot showing all the irradiance, regardless of the flags that are set.
euvsa_304_irrad = np.ma.filled(euvs_data["irr_304"][:], np.nan)
# Define an array of the EUVS-A 30.4 nm irradiance values and replace the missing and fill values in the irradiance with NaN values. The missing and fill values in the NetCDF data array are masked indices. The np.ma.filled() code is a simple way to replace the masked values with NaNs, which excludes them from plotting and numerical operations.

plt.figure(figsize = (25, 20))
plt.plot(euvs_timestamps, euvsa_304_irrad , color = 'blue', label = r'$\lambda$ = 30.4 nm', marker = '.', \
         markersize = 10, linestyle = 'none')
plt.rc('font', size = 23)
plt.xlabel('Hour', fontsize = 30)
plt.ylabel('Irradiance (W/m$^2$)', fontsize = 30)
plt.gca().xaxis.set_major_locator(mdates.HourLocator())
plt.gca().xaxis.set_major_formatter(mdates.DateFormatter('%H'))
plt.gca().xaxis.set_minor_locator(mdates.MinuteLocator([15, 30, 45]))
plt.gca().yaxis.set_minor_locator(tck.AutoMinorLocator(5))
plt.tick_params(axis = 'x', which = 'major', length = 18, width = 2, direction = 'in')
plt.tick_params(axis = 'x', which = 'minor', length = 8, width = 2, direction = 'in')
plt.tick_params(axis = 'y', which = 'major', length = 18, width = 2, direction = 'in')
plt.tick_params(axis = 'y', which = 'minor', length = 8, width = 2, direction = 'in')
plt.xticks(fontsize = 25, ha = 'center')
plt.yticks(fontsize = 23)
lg = plt.legend(loc = 'lower right', fontsize = 30, numpoints = 1)
lg.legend_handles[0].set_markersize(30)
plt.margins(0.02, 0.05)
plt.title('GOES-16 EUVS-A 30.4 nm Irradiance: ' + euvs_timestamps[0].strftime("%Y-%m-%d"), fontsize = 40, y = 1.02)
#plt.xlim([datetime.datetime(euvsa_timestamps[0].year, euvsa_timestamps[0].month, euvsa_timestamps[0].day, HH, MM), \
          #datetime.datetime(euvsa_timestamps[0].year, euvsa_timestamps[0].month, euvsa_timestamps[0].day, HH, MM)]
# Plot EUVS-A irradiance.
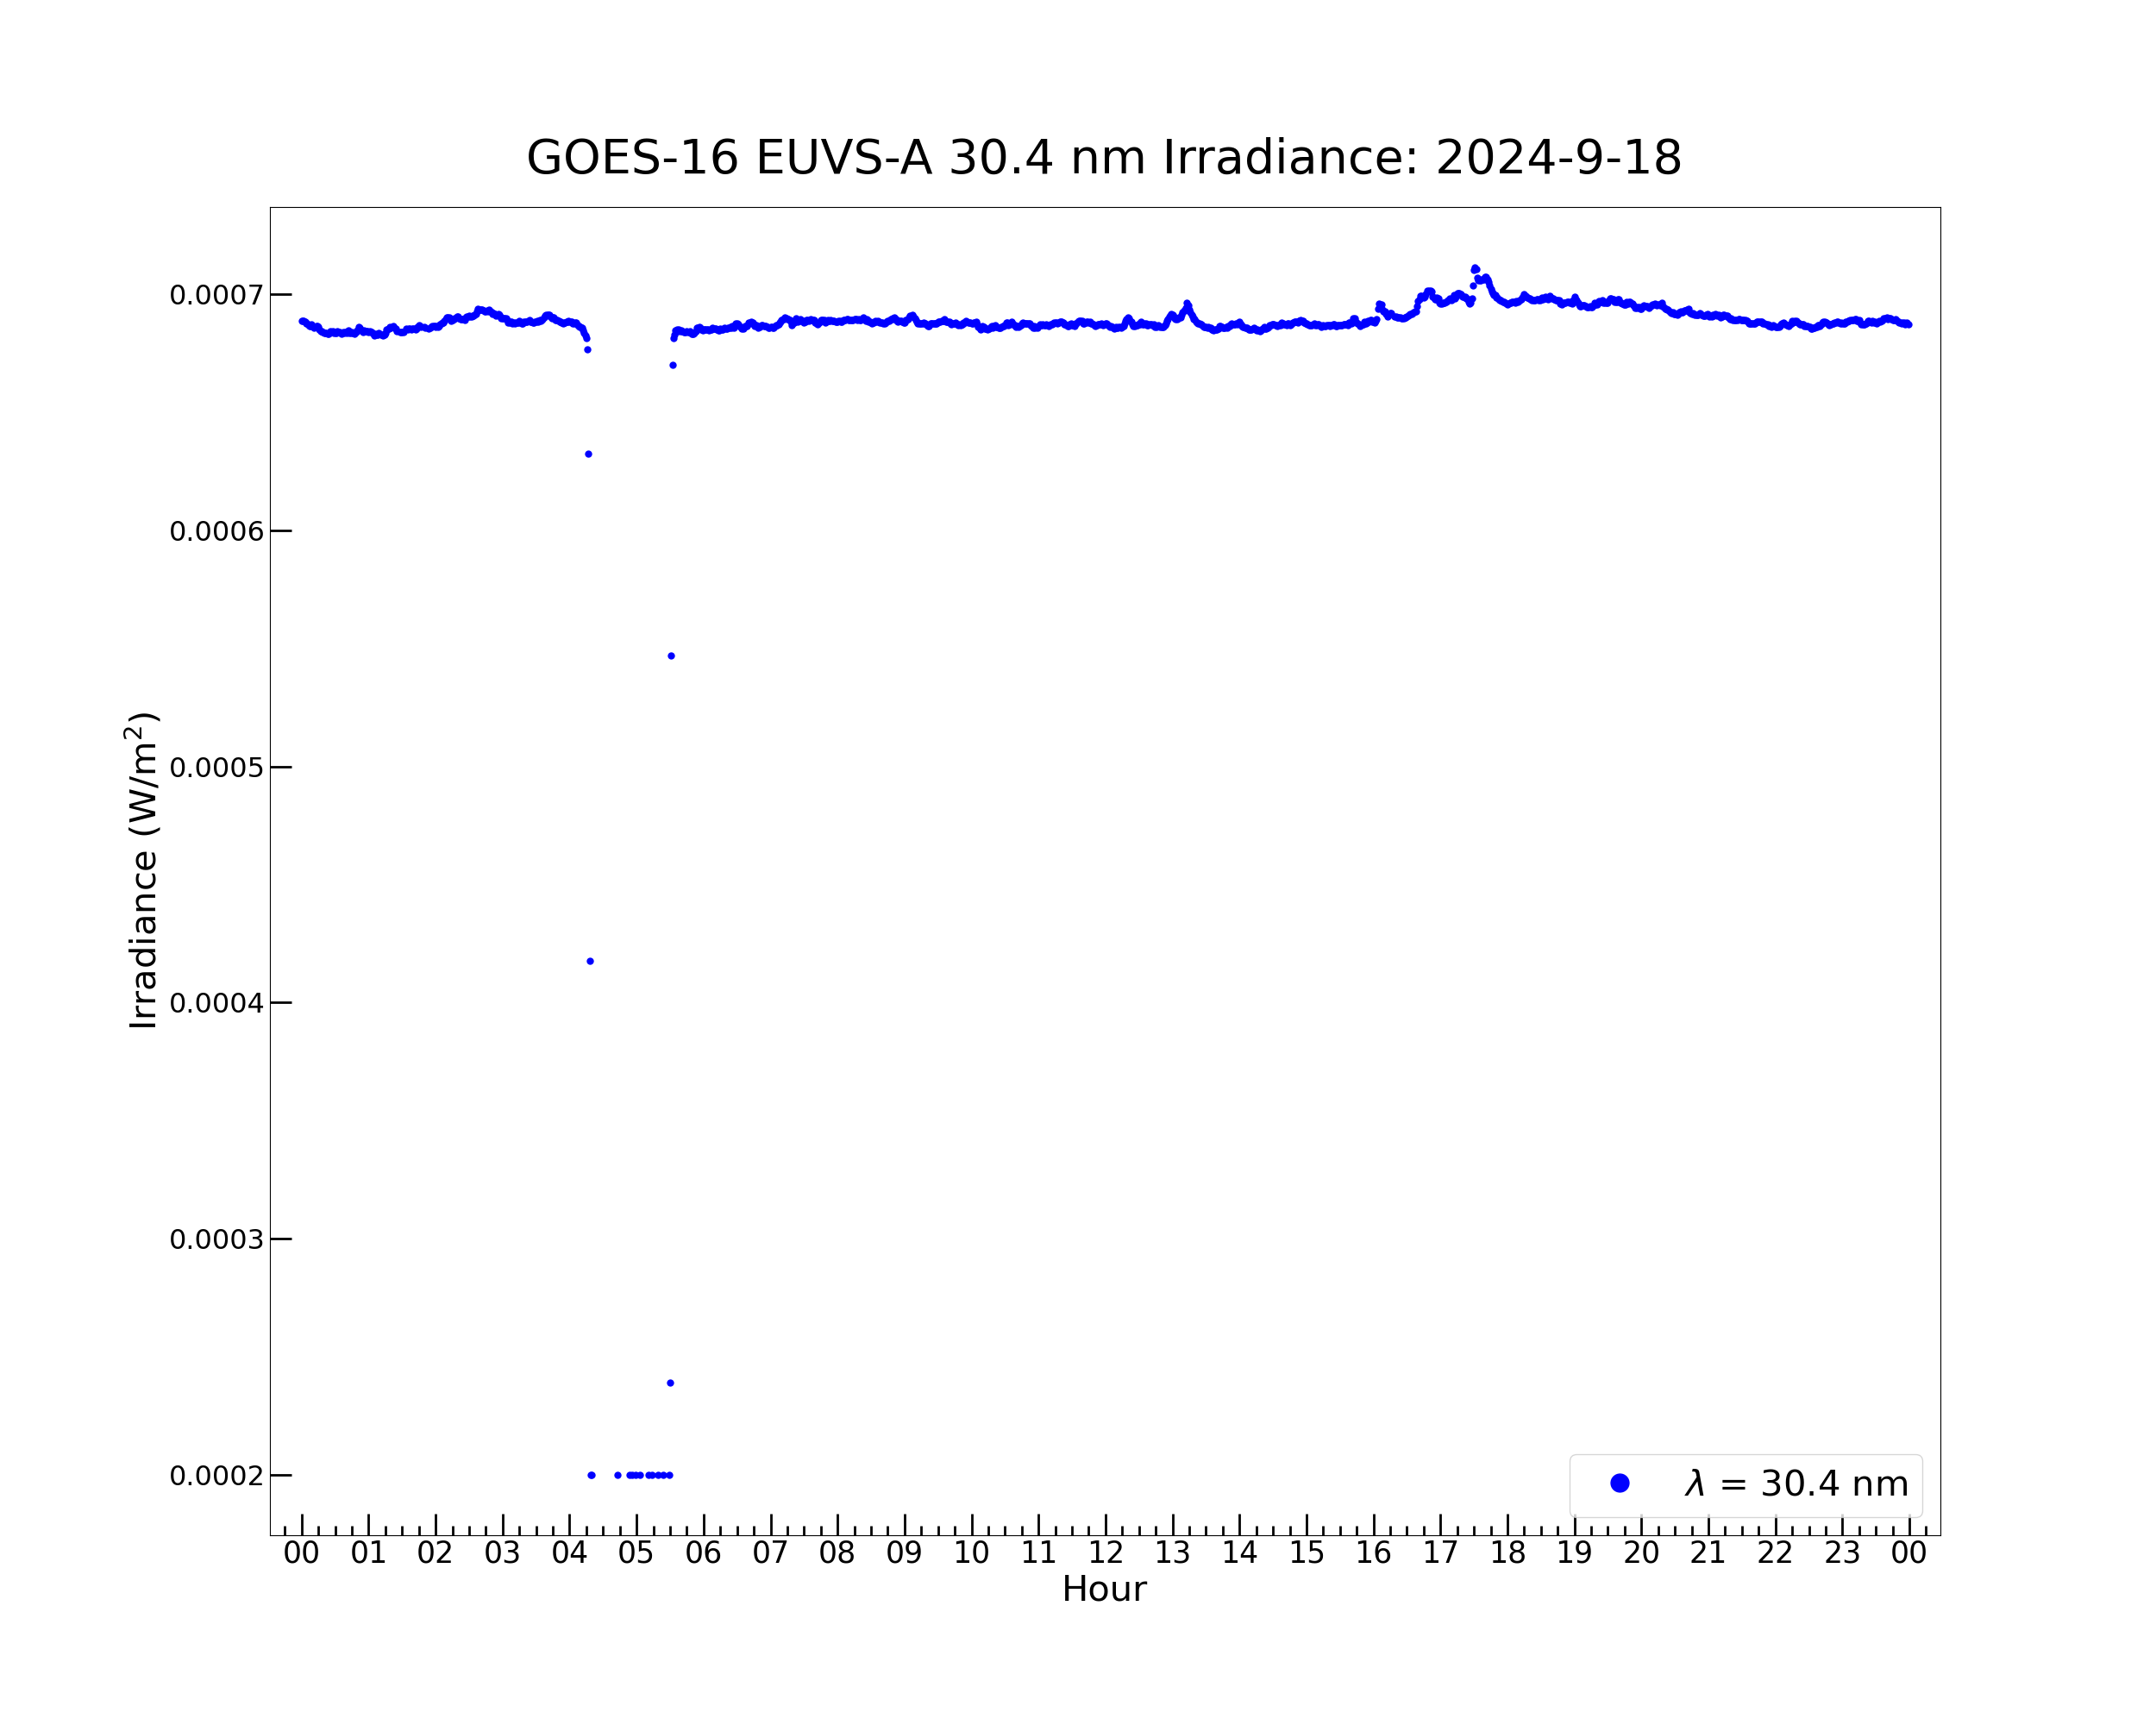
Text(0.5, 1.02, 'GOES-16 EUVS-A 30.4 nm Irradiance: 2024-09-18')
This plot shows the irradiance drop in the penumbra before and after the eclipse. The gap at 04:21-05:27 is the eclipse umbra, when the Sun is not visible and there is no data.
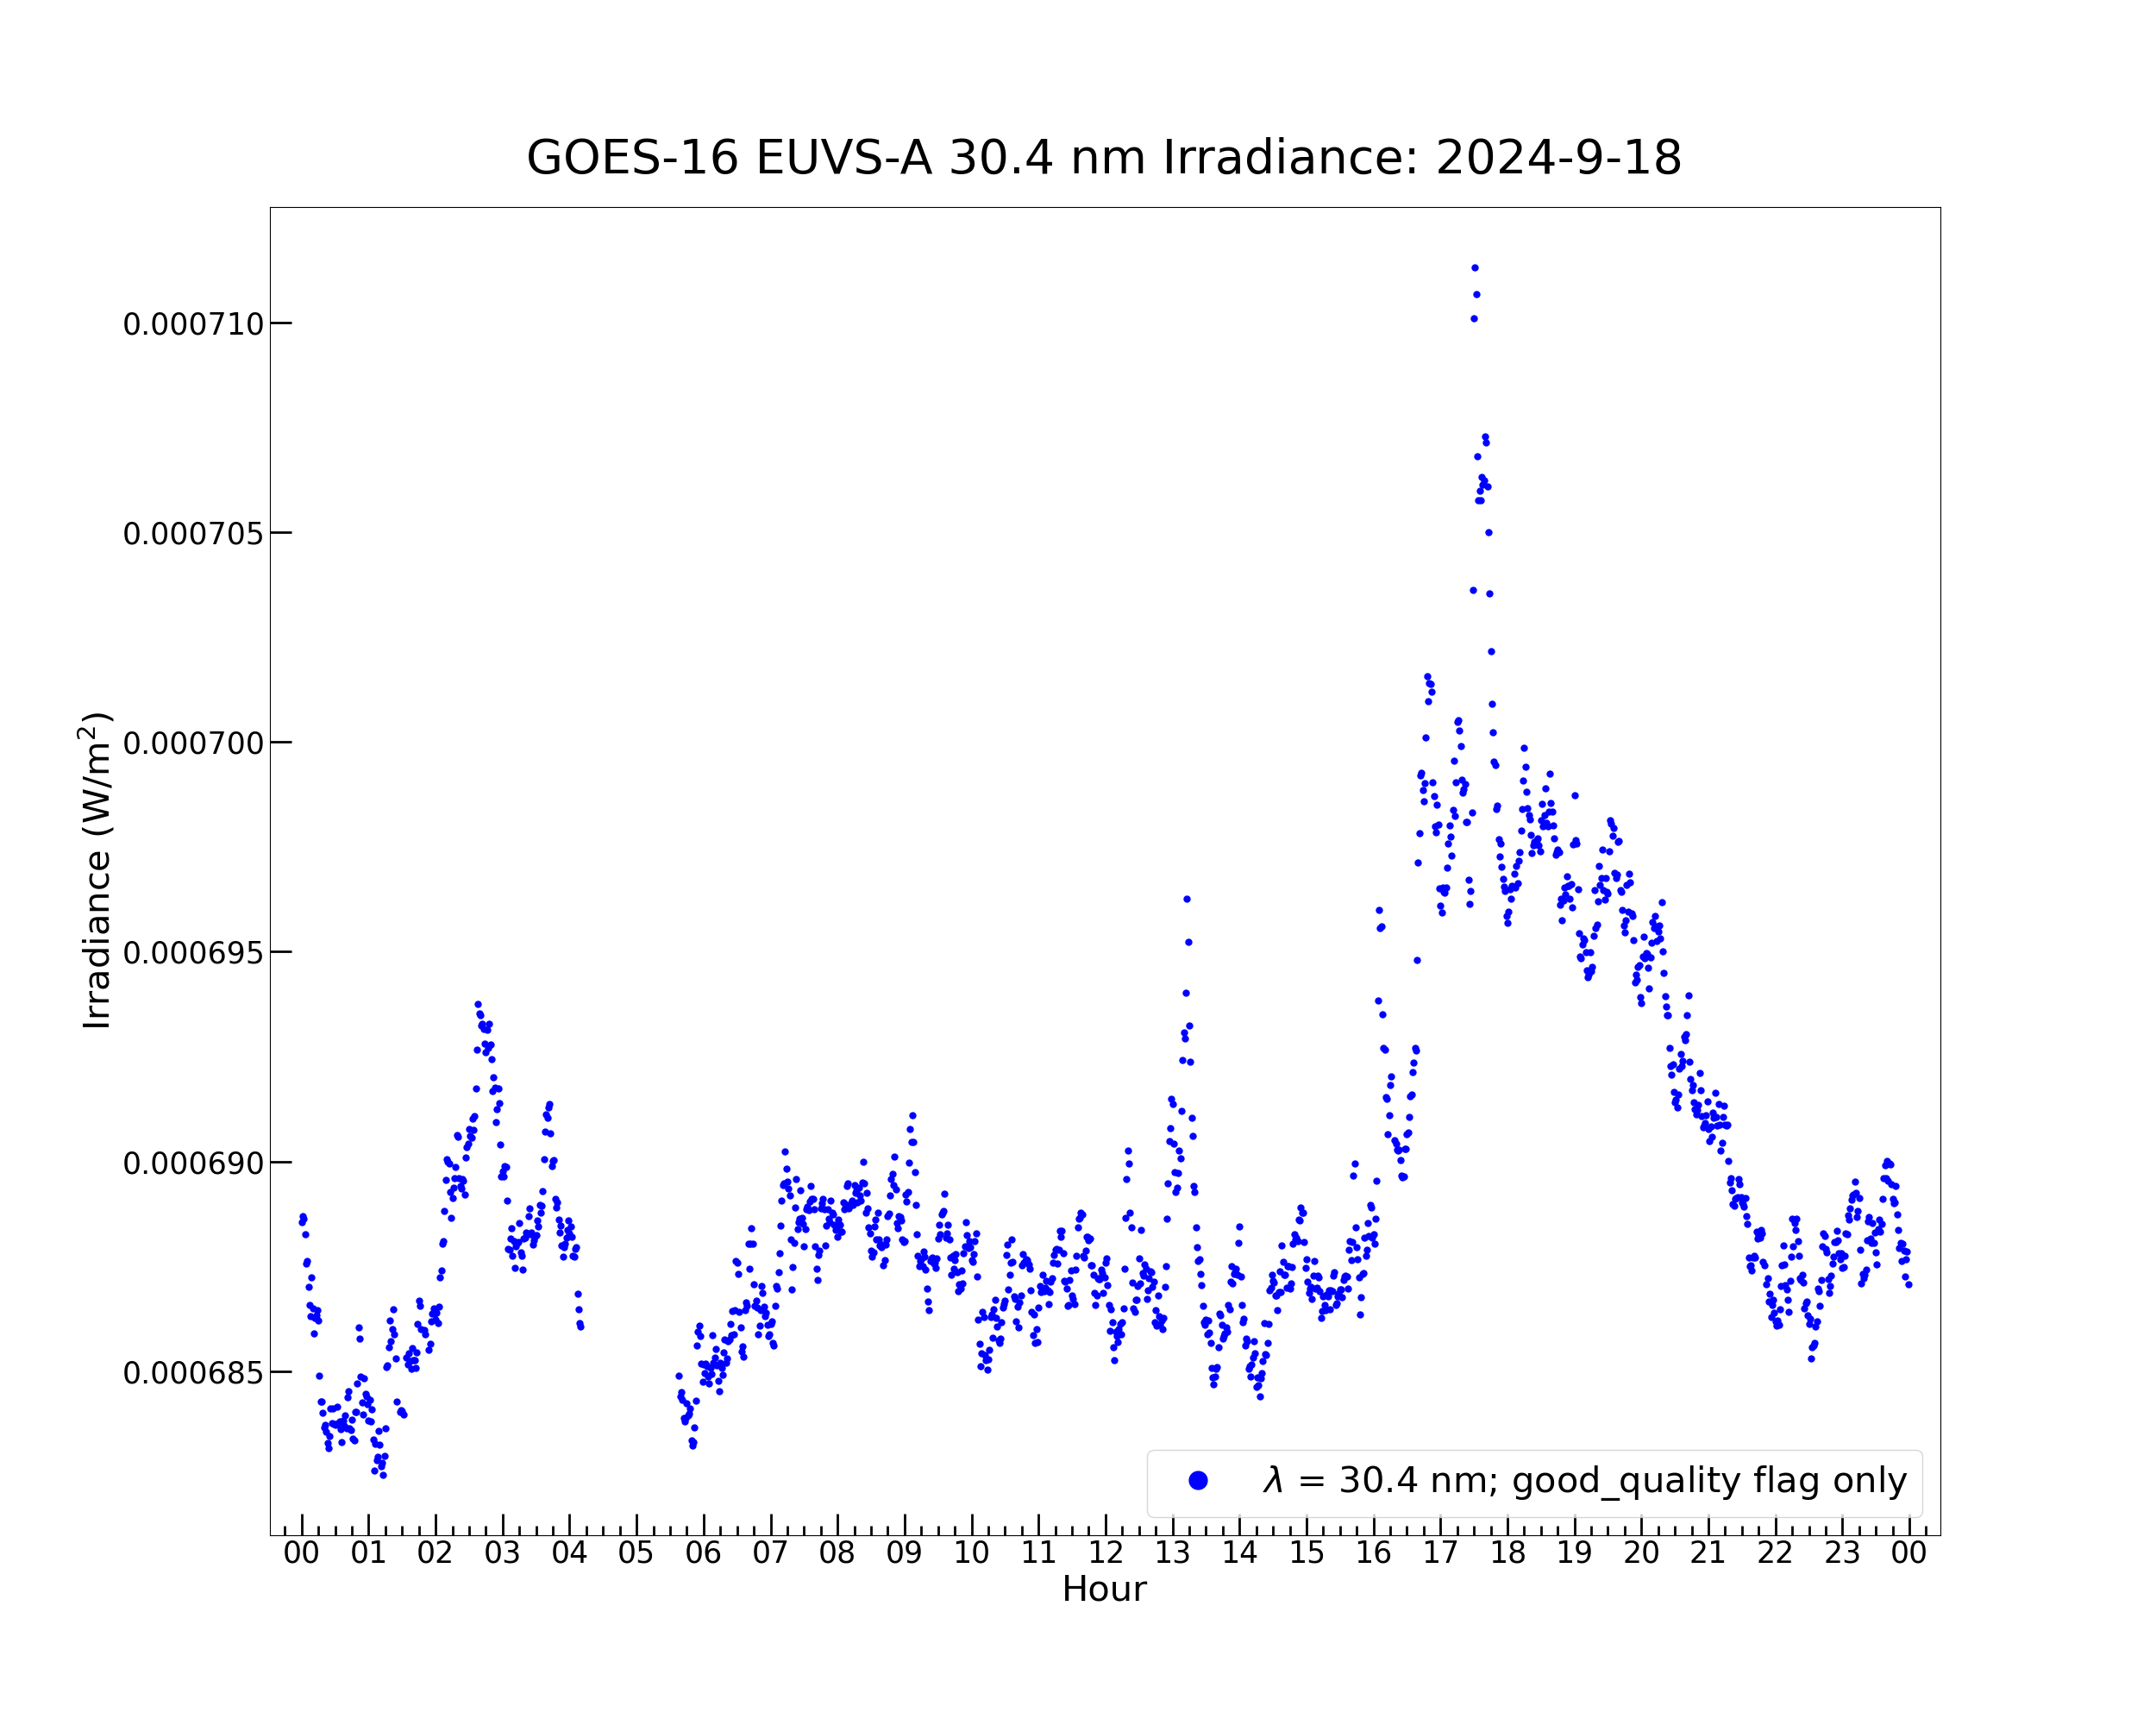
Now plot the irradiance at the indices where only the ‘good_quality’ flag is set. The [good_quality_flag] array, containing the indices at which the ‘good_quality’ flag is set, is used to index the timestamp and irradiance arrays.
plt.figure(figsize = (25, 20))
plt.plot(euvs_timestamps[good_quality_flag], euvsa_304_irrad[good_quality_flag] , color = 'blue', label = \
         r'$\lambda$ = 30.4 nm; good_quality flag only', marker = '.', markersize = 10, linestyle = 'none')
plt.rc('font', size = 25)
plt.xlabel('Hour', fontsize = 30)
plt.ylabel('Irradiance (W/m$^2$)', fontsize = 30)
plt.gca().xaxis.set_major_locator(mdates.HourLocator())
plt.gca().xaxis.set_major_formatter(mdates.DateFormatter('%H'))
plt.gca().xaxis.set_minor_locator(mdates.MinuteLocator([15, 30, 45]))
plt.gca().yaxis.set_minor_locator(tck.AutoMinorLocator(5))
plt.tick_params(axis = 'x', which = 'major', length = 18, width = 2, direction = 'in')
plt.tick_params(axis = 'x', which = 'minor', length = 8, width = 2, direction = 'in')
plt.tick_params(axis = 'y', which = 'major', length = 18, width = 2, direction = 'in')
plt.tick_params(axis = 'y', which = 'minor', length = 8, width = 2, direction = 'in')
plt.xticks(fontsize = 25, ha = 'center')
plt.yticks(fontsize = 25)
lg = plt.legend(loc = 'lower right', fontsize = 30, numpoints = 1)
lg.legend_handles[0].set_markersize(30)
plt.margins(0.02, 0.05)
plt.title('GOES-16 EUVS-A 30.4 nm Irradiance: ' + euvs_timestamps[0].strftime("%Y-%m-%d"), fontsize = 40, y = 1.02)
# Plot EUVS-A irradiance.
Text(0.5, 1.02, 'GOES-16 EUVS-A 30.4 nm Irradiance: 2024-09-18')
This plot excludes the irradiance in the penumbra before and after the umbra. Now the variation in the irradiance is easier to see.
The quality flags can be plotted in the same figure as the irradiance. This allows for easier visualization of the flagged irradiance. The plot below shows the irradiance where the ‘good_quality’ flag is set on the left y-axis and the quality flags plotted as a time series on the right y-axis.
plt.figure(figsize = (25, 20))
plt.plot(euvs_timestamps[good_quality_flag], euvsa_304_irrad[good_quality_flag] , color = 'blue', label = r'$\lambda$ = 30.4 nm', marker = \
         '.', markersize = 10, linestyle = 'none')
plt.rc('font', size = 25)
plt.xlabel('Hour', fontsize = 30)
plt.ylabel('Irradiance (W/m$^2$)', fontsize = 30)
plt.gca().xaxis.set_major_locator(mdates.HourLocator())
plt.gca().xaxis.set_major_formatter(mdates.DateFormatter('%H'))
plt.gca().xaxis.set_minor_locator(mdates.MinuteLocator([15, 30, 45]))
plt.gca().yaxis.set_minor_locator(tck.AutoMinorLocator(5))
plt.tick_params(axis = 'x', which = 'major', length = 18, width = 2, direction = 'in')
plt.tick_params(axis = 'x', which = 'minor', length = 8, width = 2, direction = 'in')
plt.tick_params(axis = 'y', which = 'major', length = 18, width = 2, direction = 'in')
plt.tick_params(axis = 'y', which = 'minor', length = 8, width = 2, direction = 'in')
plt.xticks(fontsize = 25, ha = 'center')
plt.yticks(fontsize = 25)
lg = plt.legend(loc = 'upper right', fontsize = 30, numpoints = 1)
lg.legend_handles[0].set_markersize(30)
plt.margins(0.02, 0.05)
plt.title('GOES-16 EUVS-A 30.4 nm Irradiance: ' + euvs_timestamps[0].strftime("%Y-%m-%d"), fontsize = 40, y = 1.02)
#plt.xlim([datetime.datetime(euvs_timestamps[0].year, euvs_timestamps[0].month, euvs_timestamps[0].day, 3, 30), \
          #datetime.datetime(euvs_timestamps[0].year, euvs_timestamps[0].month, euvs_timestamps[0].day, 6, 30)])
# Plot EUVS-A irradiance.

plt.twinx()
# Create a second x/y-axis pair to show the quality flags on a new y-axis on the right side of the plot.
# The x-axis is the same for both sets of data shown on the y-axes.

for i in euvsa_flags.flag_meanings:
# Loop over all EUVS-A quality flags.

    flag_set = euvsa_flags.get_flag(i)
    # Determine indices where current flag is and is not set.

    if np.any(flag_set):
        plt.plot(euvs_timestamps[flag_set], [i for _ in range(len(euvs_timestamps[flag_set]))], marker = 'x', linestyle = 'none', \
                 markersize = 10)
        plt.ylabel('Data Quality Flag ("x")', fontsize = 30)
        plt.yticks(fontsize = 25)
        plt.tick_params(axis = 'y', which = 'major', length = 12, width = 2, direction = 'in')
        plt.gca().xaxis.set_minor_locator(mdates.MinuteLocator([15, 30, 45]))
        plt.gca().xaxis.set_major_formatter(mdates.DateFormatter('%H'))
        plt.gca().xaxis.set_major_locator(mdates.HourLocator())
        # If the current flag is set anywhere, plot the flag at all timestamps where it is set.
# Plot quality flags on the right y-axis.
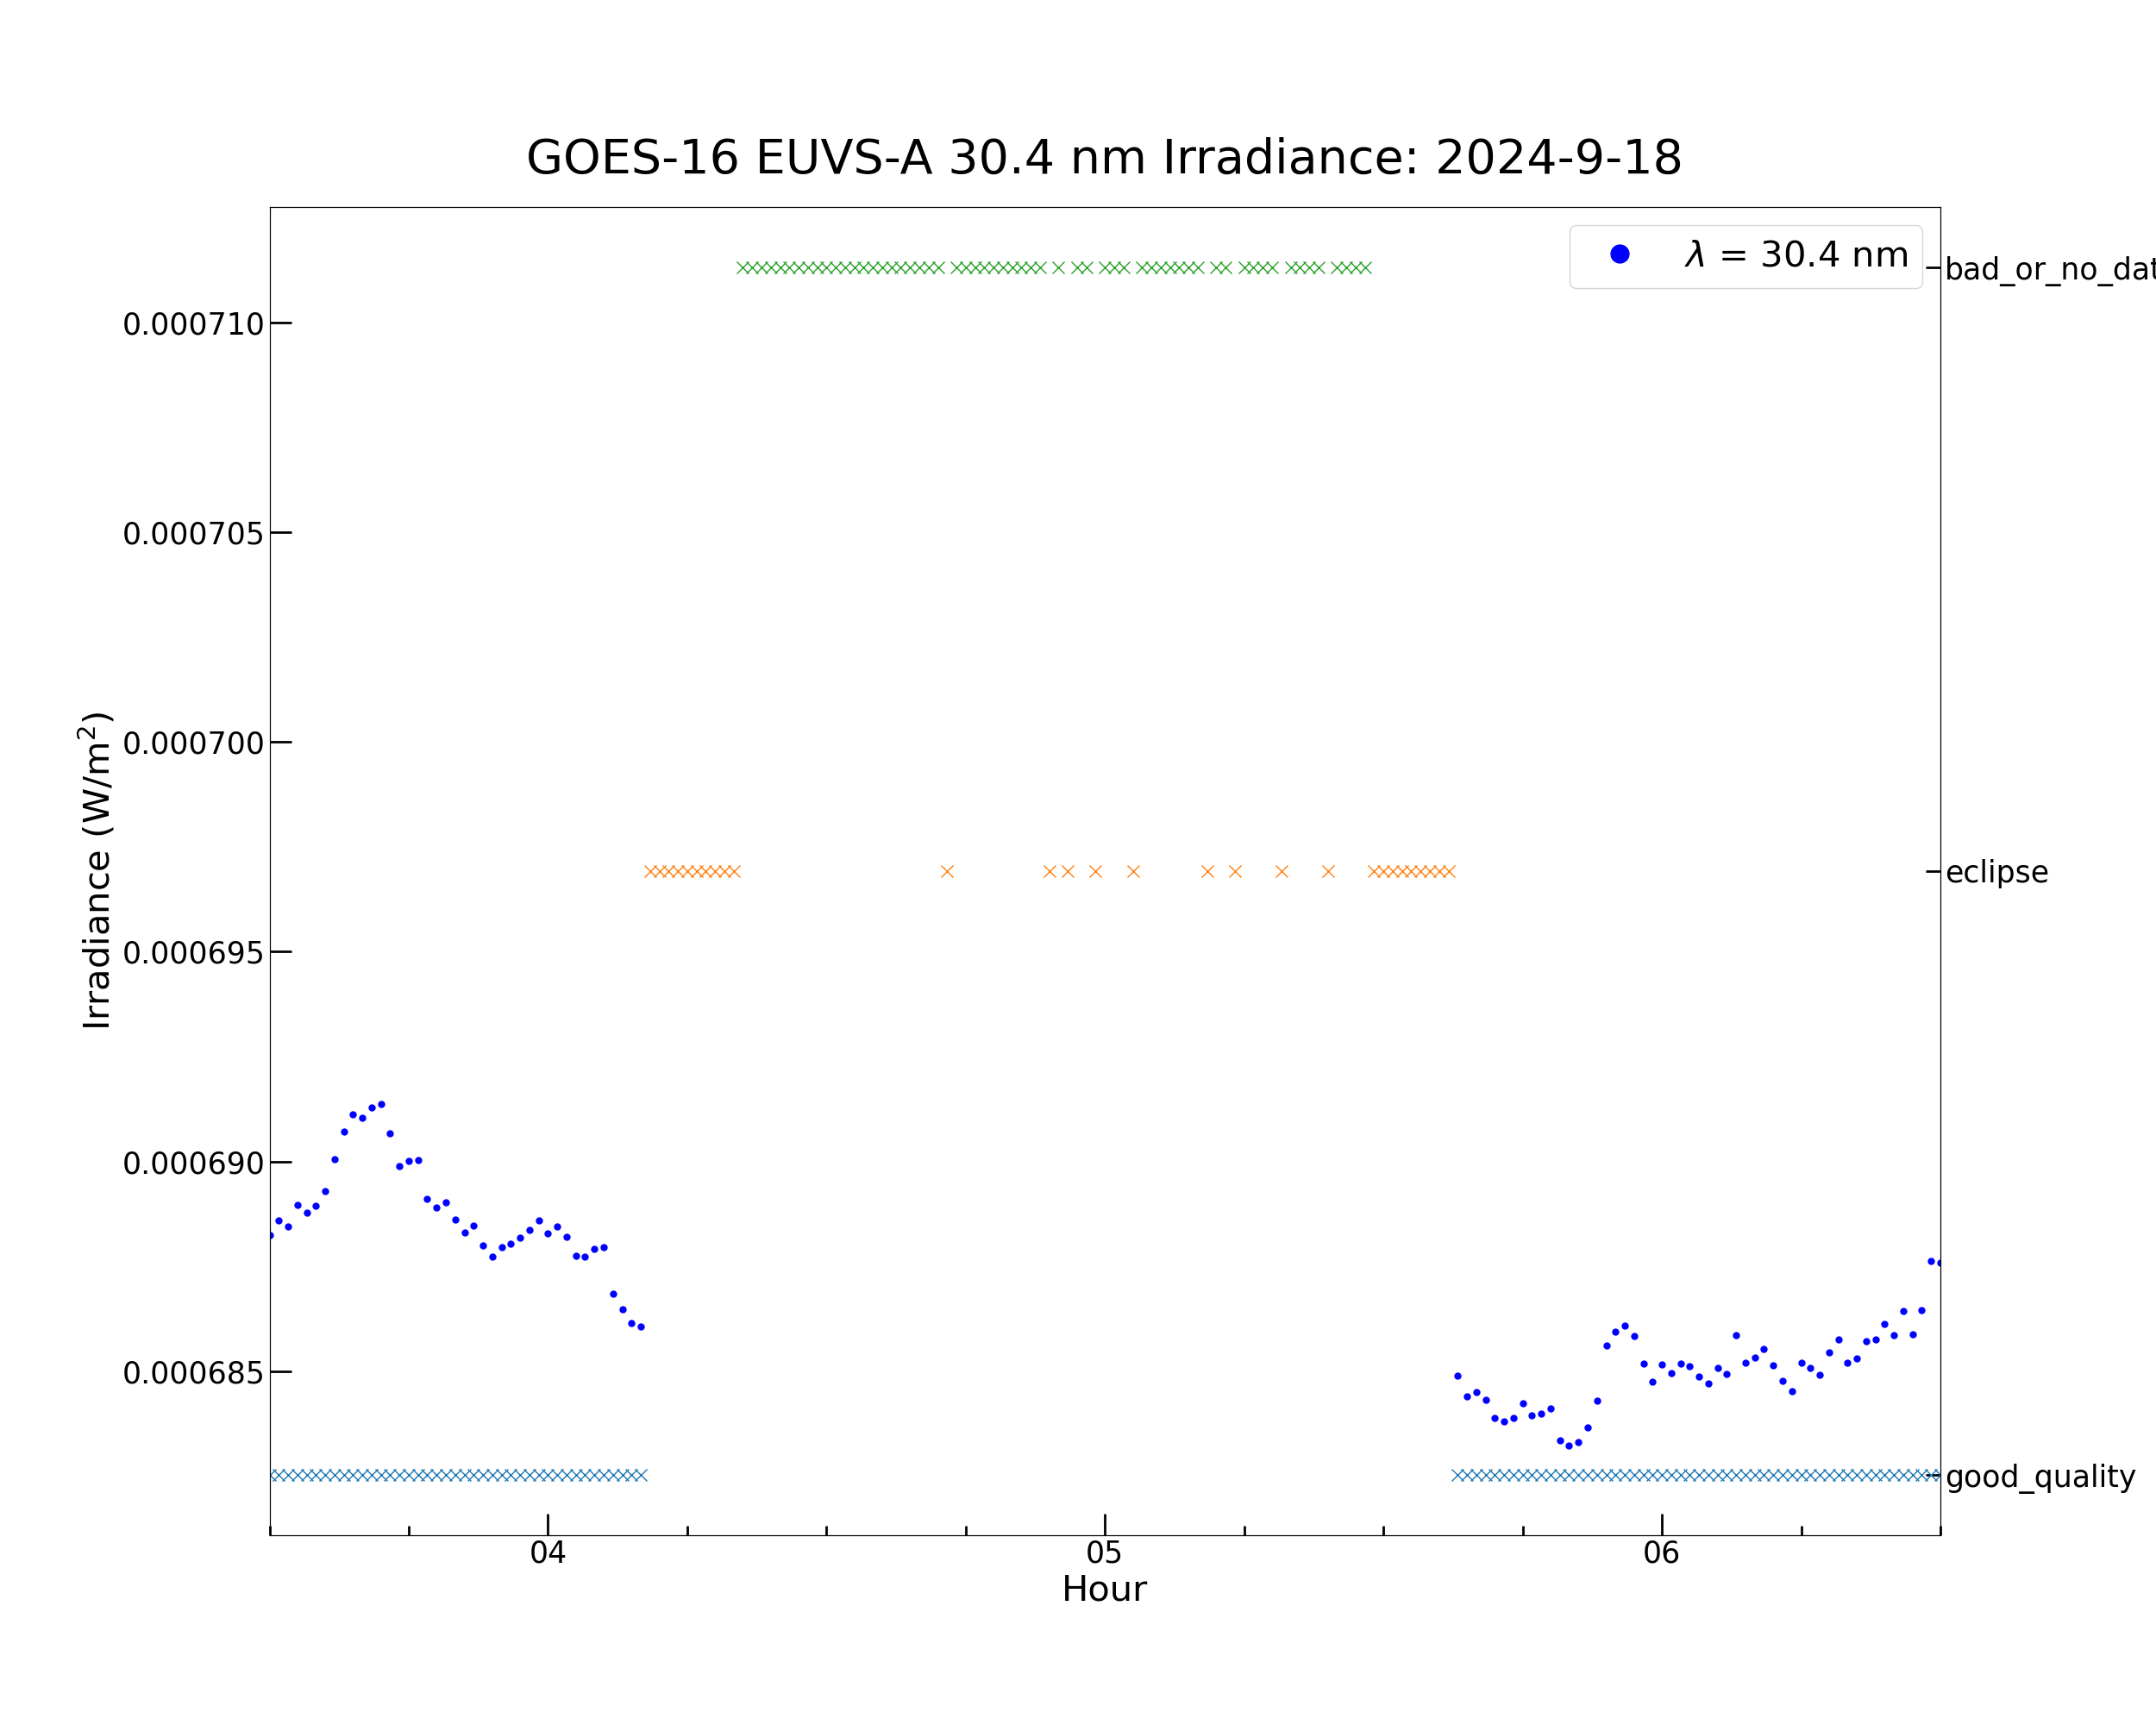
Now re-run the cell above, but this time zoom on the x-axis to 04:00-06:00. This allows for a closer look at the irradiance around the eclipse.
The combination of the ‘eclipse’ flag in the pre and post-umbra penumbra and the ‘bad_or_no_data’ flag in the umbra define the eclipse.
EUVS-B Irradiance
The EUVS-B irradiance can be plotted and analyzed in much the same way as EUVS-B. The most significant difference is in the 121.6 nm irradiance (Lyman-alpha line).
The 121 nm irradiance is affected by geocoronal absoprtion. This wavelength is absorbed by the uppermost layers of Earth’s atmosphere. This absorption appears as a dip in the irradiance time series, similar to the irradiance during the eclipse. The geocorona absorption has its own quality flag, set in the ‘geocorona_flag’ variable in the NetCDF file.
First, print the 121.6 nm irradiance and quality flag variables, and the geocorona flag variable.
print(euvs_data["irr_1216"])
print('')
print(euvs_data["irr_1216_flag"])
print('')
print(euvs_data["geocorona_flag"])
<class 'netCDF4.Variable'>
float32 irr_1216(time)
    long_name: Average irradiance for 121.6-nm line.
    units: W/m2
    _FillValue: -9999.0
    valid_min: 0.004
    valid_max: 0.2
unlimited dimensions: time
current shape = (1440,)
filling off

<class 'netCDF4.Variable'>
uint8 irr_1216_flag(time)
    long_name: Flag for irr_1216.
    _FillValue: 255
    flag_masks: [7 1 2 4]
    flag_values: [0 1 2 4]
    flag_meanings: good_quality eclipse lunar_transit bad_or_no_data
unlimited dimensions: time
current shape = (1440,)
filling off

<class 'netCDF4.Variable'>
uint8 geocorona_flag(time)
    long_name: Geocoronal flag.
    comments: Flag set if any point in the average is indicated as majorly impacted by the geocorona.
    _FillValue: 255
    flag_masks: [1 1]
    flag_values: [0 1]
    flag_meanings: none degraded_due_to_geocorona
unlimited dimensions: time
current shape = (1440,)
filling off
The irradiance and quality flag variables can be analyzed the same as EUVS-A. The geocorona flag variable is parsed using ncflag.
euvsb_flags = ncflag.FlagWrap.init_from_netcdf(euvs_data["irr_1216_flag"])
good_quality_flag = euvsb_flags.get_flag('good_quality')
print(euvsb_flags.flag_meanings)
print(euvs_data["irr_1216_flag"].flag_values)
print('')

print('Number of indices at which the EUVSB quality flags are set:')
for i in euvsb_flags.flag_meanings:
# Loop over all indices in the flag_meanings array of the euvsa_flags object.

    flag_set = euvsb_flags.get_flag(i)
    # Determine indices where the current flag is and is not set. Every index is assigned a Boolean value:
    # True means the flag is set, False means the flag is not set.

    flag_frequency = np.count_nonzero(flag_set)
    print(f"{i:<14}: {flag_frequency}")
    # Print the number of indices at which each flag is set.

geocorona_flag = ncflag.FlagWrap.init_from_netcdf(euvs_data["geocorona_flag"])
print(geocorona_flag.flag_meanings)
print('')

print('Number of indices at which the geocorona quality flag is set:')
for j in geocorona_flag.flag_meanings:
# Loop over all the indicies in the flag_meanings array of the geocorona_flag object.

    flag_set = geocorona_flag.get_flag(j)
    # Determine indices where the current flag is and is not set. Every index is assigned a Boolean value:
    # True means the flag is set, False means the flag is not set.

    flag_frequency = np.count_nonzero(flag_set)
    print(f"{j:<25}: {flag_frequency}")
    # Print the number of indices at which each flag is set.
['good_quality', 'eclipse', 'lunar_transit', 'bad_or_no_data']
[0 1 2 4]

Number of indices at which the EUVSB quality flags are set:
good_quality  : 1342
eclipse       : 33
lunar_transit : 0
bad_or_no_data: 65
['none', 'degraded_due_to_geocorona']

Number of indices at which the geocorona quality flag is set:
none                     : 1079
degraded_due_to_geocorona: 361
The geocorona flag is set at 361 timestamps (6 total hours) on this day. Now check the timestamps at which it is set.
geocorona_flag_set = geocorona_flag.get_flag('degraded_due_to_geocorona')
geocorona_timestamps = euvs_timestamps[geocorona_flag_set]
# Extract the timestamps at which the geocorona flag is set.

print('The "degraded_due_to_geocorona" flag is set at the following timestamps: ' + str(geocorona_timestamps))
The "degraded_due_to_geocorona" flag is set at the following timestamps: [real_datetime(2024, 9, 18, 2, 0) real_datetime(2024, 9, 18, 2, 1)
 real_datetime(2024, 9, 18, 2, 2) real_datetime(2024, 9, 18, 2, 3)
 real_datetime(2024, 9, 18, 2, 4) real_datetime(2024, 9, 18, 2, 5)
 real_datetime(2024, 9, 18, 2, 6) real_datetime(2024, 9, 18, 2, 7)
 real_datetime(2024, 9, 18, 2, 8) real_datetime(2024, 9, 18, 2, 9)
 real_datetime(2024, 9, 18, 2, 10) real_datetime(2024, 9, 18, 2, 11)
 real_datetime(2024, 9, 18, 2, 12) real_datetime(2024, 9, 18, 2, 13)
 real_datetime(2024, 9, 18, 2, 14) real_datetime(2024, 9, 18, 2, 15)
 real_datetime(2024, 9, 18, 2, 16) real_datetime(2024, 9, 18, 2, 17)
 real_datetime(2024, 9, 18, 2, 18) real_datetime(2024, 9, 18, 2, 19)
 real_datetime(2024, 9, 18, 2, 20) real_datetime(2024, 9, 18, 2, 21)
 real_datetime(2024, 9, 18, 2, 22) real_datetime(2024, 9, 18, 2, 23)
 real_datetime(2024, 9, 18, 2, 24) real_datetime(2024, 9, 18, 2, 25)
 real_datetime(2024, 9, 18, 2, 26) real_datetime(2024, 9, 18, 2, 27)
 real_datetime(2024, 9, 18, 2, 28) real_datetime(2024, 9, 18, 2, 29)
 real_datetime(2024, 9, 18, 2, 30) real_datetime(2024, 9, 18, 2, 31)
 real_datetime(2024, 9, 18, 2, 32) real_datetime(2024, 9, 18, 2, 33)
 real_datetime(2024, 9, 18, 2, 34) real_datetime(2024, 9, 18, 2, 35)
 real_datetime(2024, 9, 18, 2, 36) real_datetime(2024, 9, 18, 2, 37)
 real_datetime(2024, 9, 18, 2, 38) real_datetime(2024, 9, 18, 2, 39)
 real_datetime(2024, 9, 18, 2, 40) real_datetime(2024, 9, 18, 2, 41)
 real_datetime(2024, 9, 18, 2, 42) real_datetime(2024, 9, 18, 2, 43)
 real_datetime(2024, 9, 18, 2, 44) real_datetime(2024, 9, 18, 2, 45)
 real_datetime(2024, 9, 18, 2, 46) real_datetime(2024, 9, 18, 2, 47)
 real_datetime(2024, 9, 18, 2, 48) real_datetime(2024, 9, 18, 2, 49)
 real_datetime(2024, 9, 18, 2, 50) real_datetime(2024, 9, 18, 2, 51)
 real_datetime(2024, 9, 18, 2, 52) real_datetime(2024, 9, 18, 2, 53)
 real_datetime(2024, 9, 18, 2, 54) real_datetime(2024, 9, 18, 2, 55)
 real_datetime(2024, 9, 18, 2, 56) real_datetime(2024, 9, 18, 2, 57)
 real_datetime(2024, 9, 18, 2, 58) real_datetime(2024, 9, 18, 2, 59)
 real_datetime(2024, 9, 18, 3, 0) real_datetime(2024, 9, 18, 3, 1)
 real_datetime(2024, 9, 18, 3, 2) real_datetime(2024, 9, 18, 3, 3)
 real_datetime(2024, 9, 18, 3, 4) real_datetime(2024, 9, 18, 3, 5)
 real_datetime(2024, 9, 18, 3, 6) real_datetime(2024, 9, 18, 3, 7)
 real_datetime(2024, 9, 18, 3, 8) real_datetime(2024, 9, 18, 3, 9)
 real_datetime(2024, 9, 18, 3, 10) real_datetime(2024, 9, 18, 3, 11)
 real_datetime(2024, 9, 18, 3, 12) real_datetime(2024, 9, 18, 3, 13)
 real_datetime(2024, 9, 18, 3, 14) real_datetime(2024, 9, 18, 3, 15)
 real_datetime(2024, 9, 18, 3, 16) real_datetime(2024, 9, 18, 3, 17)
 real_datetime(2024, 9, 18, 3, 18) real_datetime(2024, 9, 18, 3, 19)
 real_datetime(2024, 9, 18, 3, 20) real_datetime(2024, 9, 18, 3, 21)
 real_datetime(2024, 9, 18, 3, 22) real_datetime(2024, 9, 18, 3, 23)
 real_datetime(2024, 9, 18, 3, 24) real_datetime(2024, 9, 18, 3, 25)
 real_datetime(2024, 9, 18, 3, 26) real_datetime(2024, 9, 18, 3, 27)
 real_datetime(2024, 9, 18, 3, 28) real_datetime(2024, 9, 18, 3, 29)
 real_datetime(2024, 9, 18, 3, 30) real_datetime(2024, 9, 18, 3, 31)
 real_datetime(2024, 9, 18, 3, 32) real_datetime(2024, 9, 18, 3, 33)
 real_datetime(2024, 9, 18, 3, 34) real_datetime(2024, 9, 18, 3, 35)
 real_datetime(2024, 9, 18, 3, 36) real_datetime(2024, 9, 18, 3, 37)
 real_datetime(2024, 9, 18, 3, 38) real_datetime(2024, 9, 18, 3, 39)
 real_datetime(2024, 9, 18, 3, 40) real_datetime(2024, 9, 18, 3, 41)
 real_datetime(2024, 9, 18, 3, 42) real_datetime(2024, 9, 18, 3, 43)
 real_datetime(2024, 9, 18, 3, 44) real_datetime(2024, 9, 18, 3, 45)
 real_datetime(2024, 9, 18, 3, 46) real_datetime(2024, 9, 18, 3, 47)
 real_datetime(2024, 9, 18, 3, 48) real_datetime(2024, 9, 18, 3, 49)
 real_datetime(2024, 9, 18, 3, 50) real_datetime(2024, 9, 18, 3, 51)
 real_datetime(2024, 9, 18, 3, 52) real_datetime(2024, 9, 18, 3, 53)
 real_datetime(2024, 9, 18, 3, 54) real_datetime(2024, 9, 18, 3, 55)
 real_datetime(2024, 9, 18, 3, 56) real_datetime(2024, 9, 18, 3, 57)
 real_datetime(2024, 9, 18, 3, 58) real_datetime(2024, 9, 18, 3, 59)
 real_datetime(2024, 9, 18, 4, 0) real_datetime(2024, 9, 18, 4, 1)
 real_datetime(2024, 9, 18, 4, 2) real_datetime(2024, 9, 18, 4, 3)
 real_datetime(2024, 9, 18, 4, 4) real_datetime(2024, 9, 18, 4, 5)
 real_datetime(2024, 9, 18, 4, 6) real_datetime(2024, 9, 18, 4, 7)
 real_datetime(2024, 9, 18, 4, 8) real_datetime(2024, 9, 18, 4, 9)
 real_datetime(2024, 9, 18, 4, 10) real_datetime(2024, 9, 18, 4, 11)
 real_datetime(2024, 9, 18, 4, 12) real_datetime(2024, 9, 18, 4, 13)
 real_datetime(2024, 9, 18, 4, 14) real_datetime(2024, 9, 18, 4, 15)
 real_datetime(2024, 9, 18, 4, 16) real_datetime(2024, 9, 18, 4, 17)
 real_datetime(2024, 9, 18, 4, 18) real_datetime(2024, 9, 18, 4, 19)
 real_datetime(2024, 9, 18, 4, 20) real_datetime(2024, 9, 18, 4, 21)
 real_datetime(2024, 9, 18, 4, 22) real_datetime(2024, 9, 18, 4, 23)
 real_datetime(2024, 9, 18, 4, 24) real_datetime(2024, 9, 18, 4, 25)
 real_datetime(2024, 9, 18, 4, 26) real_datetime(2024, 9, 18, 4, 27)
 real_datetime(2024, 9, 18, 4, 28) real_datetime(2024, 9, 18, 4, 29)
 real_datetime(2024, 9, 18, 4, 30) real_datetime(2024, 9, 18, 4, 31)
 real_datetime(2024, 9, 18, 4, 32) real_datetime(2024, 9, 18, 4, 33)
 real_datetime(2024, 9, 18, 4, 34) real_datetime(2024, 9, 18, 4, 35)
 real_datetime(2024, 9, 18, 4, 36) real_datetime(2024, 9, 18, 4, 37)
 real_datetime(2024, 9, 18, 4, 38) real_datetime(2024, 9, 18, 4, 39)
 real_datetime(2024, 9, 18, 4, 40) real_datetime(2024, 9, 18, 4, 41)
 real_datetime(2024, 9, 18, 4, 42) real_datetime(2024, 9, 18, 4, 43)
 real_datetime(2024, 9, 18, 4, 44) real_datetime(2024, 9, 18, 4, 45)
 real_datetime(2024, 9, 18, 4, 46) real_datetime(2024, 9, 18, 4, 47)
 real_datetime(2024, 9, 18, 4, 48) real_datetime(2024, 9, 18, 4, 49)
 real_datetime(2024, 9, 18, 4, 50) real_datetime(2024, 9, 18, 4, 51)
 real_datetime(2024, 9, 18, 4, 52) real_datetime(2024, 9, 18, 4, 53)
 real_datetime(2024, 9, 18, 4, 54) real_datetime(2024, 9, 18, 4, 55)
 real_datetime(2024, 9, 18, 4, 56) real_datetime(2024, 9, 18, 4, 57)
 real_datetime(2024, 9, 18, 4, 58) real_datetime(2024, 9, 18, 4, 59)
 real_datetime(2024, 9, 18, 5, 0) real_datetime(2024, 9, 18, 5, 1)
 real_datetime(2024, 9, 18, 5, 2) real_datetime(2024, 9, 18, 5, 3)
 real_datetime(2024, 9, 18, 5, 4) real_datetime(2024, 9, 18, 5, 5)
 real_datetime(2024, 9, 18, 5, 6) real_datetime(2024, 9, 18, 5, 7)
 real_datetime(2024, 9, 18, 5, 8) real_datetime(2024, 9, 18, 5, 9)
 real_datetime(2024, 9, 18, 5, 10) real_datetime(2024, 9, 18, 5, 11)
 real_datetime(2024, 9, 18, 5, 12) real_datetime(2024, 9, 18, 5, 13)
 real_datetime(2024, 9, 18, 5, 14) real_datetime(2024, 9, 18, 5, 15)
 real_datetime(2024, 9, 18, 5, 16) real_datetime(2024, 9, 18, 5, 17)
 real_datetime(2024, 9, 18, 5, 18) real_datetime(2024, 9, 18, 5, 19)
 real_datetime(2024, 9, 18, 5, 20) real_datetime(2024, 9, 18, 5, 21)
 real_datetime(2024, 9, 18, 5, 22) real_datetime(2024, 9, 18, 5, 23)
 real_datetime(2024, 9, 18, 5, 24) real_datetime(2024, 9, 18, 5, 25)
 real_datetime(2024, 9, 18, 5, 26) real_datetime(2024, 9, 18, 5, 27)
 real_datetime(2024, 9, 18, 5, 28) real_datetime(2024, 9, 18, 5, 29)
 real_datetime(2024, 9, 18, 5, 30) real_datetime(2024, 9, 18, 5, 31)
 real_datetime(2024, 9, 18, 5, 32) real_datetime(2024, 9, 18, 5, 33)
 real_datetime(2024, 9, 18, 5, 34) real_datetime(2024, 9, 18, 5, 35)
 real_datetime(2024, 9, 18, 5, 36) real_datetime(2024, 9, 18, 5, 37)
 real_datetime(2024, 9, 18, 5, 38) real_datetime(2024, 9, 18, 5, 39)
 real_datetime(2024, 9, 18, 5, 40) real_datetime(2024, 9, 18, 5, 41)
 real_datetime(2024, 9, 18, 5, 42) real_datetime(2024, 9, 18, 5, 43)
 real_datetime(2024, 9, 18, 5, 44) real_datetime(2024, 9, 18, 5, 45)
 real_datetime(2024, 9, 18, 5, 46) real_datetime(2024, 9, 18, 5, 47)
 real_datetime(2024, 9, 18, 5, 48) real_datetime(2024, 9, 18, 5, 49)
 real_datetime(2024, 9, 18, 5, 50) real_datetime(2024, 9, 18, 5, 51)
 real_datetime(2024, 9, 18, 5, 52) real_datetime(2024, 9, 18, 5, 53)
 real_datetime(2024, 9, 18, 5, 54) real_datetime(2024, 9, 18, 5, 55)
 real_datetime(2024, 9, 18, 5, 56) real_datetime(2024, 9, 18, 5, 57)
 real_datetime(2024, 9, 18, 5, 58) real_datetime(2024, 9, 18, 5, 59)
 real_datetime(2024, 9, 18, 6, 0) real_datetime(2024, 9, 18, 6, 1)
 real_datetime(2024, 9, 18, 6, 2) real_datetime(2024, 9, 18, 6, 3)
 real_datetime(2024, 9, 18, 6, 4) real_datetime(2024, 9, 18, 6, 5)
 real_datetime(2024, 9, 18, 6, 6) real_datetime(2024, 9, 18, 6, 7)
 real_datetime(2024, 9, 18, 6, 8) real_datetime(2024, 9, 18, 6, 9)
 real_datetime(2024, 9, 18, 6, 10) real_datetime(2024, 9, 18, 6, 11)
 real_datetime(2024, 9, 18, 6, 12) real_datetime(2024, 9, 18, 6, 13)
 real_datetime(2024, 9, 18, 6, 14) real_datetime(2024, 9, 18, 6, 15)
 real_datetime(2024, 9, 18, 6, 16) real_datetime(2024, 9, 18, 6, 17)
 real_datetime(2024, 9, 18, 6, 18) real_datetime(2024, 9, 18, 6, 19)
 real_datetime(2024, 9, 18, 6, 20) real_datetime(2024, 9, 18, 6, 21)
 real_datetime(2024, 9, 18, 6, 22) real_datetime(2024, 9, 18, 6, 23)
 real_datetime(2024, 9, 18, 6, 24) real_datetime(2024, 9, 18, 6, 25)
 real_datetime(2024, 9, 18, 6, 26) real_datetime(2024, 9, 18, 6, 27)
 real_datetime(2024, 9, 18, 6, 28) real_datetime(2024, 9, 18, 6, 29)
 real_datetime(2024, 9, 18, 6, 30) real_datetime(2024, 9, 18, 6, 31)
 real_datetime(2024, 9, 18, 6, 32) real_datetime(2024, 9, 18, 6, 33)
 real_datetime(2024, 9, 18, 6, 34) real_datetime(2024, 9, 18, 6, 35)
 real_datetime(2024, 9, 18, 6, 36) real_datetime(2024, 9, 18, 6, 37)
 real_datetime(2024, 9, 18, 6, 38) real_datetime(2024, 9, 18, 6, 39)
 real_datetime(2024, 9, 18, 6, 40) real_datetime(2024, 9, 18, 6, 41)
 real_datetime(2024, 9, 18, 6, 42) real_datetime(2024, 9, 18, 6, 43)
 real_datetime(2024, 9, 18, 6, 44) real_datetime(2024, 9, 18, 6, 45)
 real_datetime(2024, 9, 18, 6, 46) real_datetime(2024, 9, 18, 6, 47)
 real_datetime(2024, 9, 18, 6, 48) real_datetime(2024, 9, 18, 6, 49)
 real_datetime(2024, 9, 18, 6, 50) real_datetime(2024, 9, 18, 6, 51)
 real_datetime(2024, 9, 18, 6, 52) real_datetime(2024, 9, 18, 6, 53)
 real_datetime(2024, 9, 18, 6, 54) real_datetime(2024, 9, 18, 6, 55)
 real_datetime(2024, 9, 18, 6, 56) real_datetime(2024, 9, 18, 6, 57)
 real_datetime(2024, 9, 18, 6, 58) real_datetime(2024, 9, 18, 6, 59)
 real_datetime(2024, 9, 18, 7, 0) real_datetime(2024, 9, 18, 7, 1)
 real_datetime(2024, 9, 18, 7, 2) real_datetime(2024, 9, 18, 7, 3)
 real_datetime(2024, 9, 18, 7, 4) real_datetime(2024, 9, 18, 7, 5)
 real_datetime(2024, 9, 18, 7, 6) real_datetime(2024, 9, 18, 7, 7)
 real_datetime(2024, 9, 18, 7, 8) real_datetime(2024, 9, 18, 7, 9)
 real_datetime(2024, 9, 18, 7, 10) real_datetime(2024, 9, 18, 7, 11)
 real_datetime(2024, 9, 18, 7, 12) real_datetime(2024, 9, 18, 7, 13)
 real_datetime(2024, 9, 18, 7, 14) real_datetime(2024, 9, 18, 7, 15)
 real_datetime(2024, 9, 18, 7, 16) real_datetime(2024, 9, 18, 7, 17)
 real_datetime(2024, 9, 18, 7, 18) real_datetime(2024, 9, 18, 7, 19)
 real_datetime(2024, 9, 18, 7, 20) real_datetime(2024, 9, 18, 7, 21)
 real_datetime(2024, 9, 18, 7, 22) real_datetime(2024, 9, 18, 7, 23)
 real_datetime(2024, 9, 18, 7, 24) real_datetime(2024, 9, 18, 7, 25)
 real_datetime(2024, 9, 18, 7, 26) real_datetime(2024, 9, 18, 7, 27)
 real_datetime(2024, 9, 18, 7, 28) real_datetime(2024, 9, 18, 7, 29)
 real_datetime(2024, 9, 18, 7, 30) real_datetime(2024, 9, 18, 7, 31)
 real_datetime(2024, 9, 18, 7, 32) real_datetime(2024, 9, 18, 7, 33)
 real_datetime(2024, 9, 18, 7, 34) real_datetime(2024, 9, 18, 7, 35)
 real_datetime(2024, 9, 18, 7, 36) real_datetime(2024, 9, 18, 7, 37)
 real_datetime(2024, 9, 18, 7, 38) real_datetime(2024, 9, 18, 7, 39)
 real_datetime(2024, 9, 18, 7, 40) real_datetime(2024, 9, 18, 7, 41)
 real_datetime(2024, 9, 18, 7, 42) real_datetime(2024, 9, 18, 7, 43)
 real_datetime(2024, 9, 18, 7, 44) real_datetime(2024, 9, 18, 7, 45)
 real_datetime(2024, 9, 18, 7, 46) real_datetime(2024, 9, 18, 7, 47)
 real_datetime(2024, 9, 18, 7, 48) real_datetime(2024, 9, 18, 7, 49)
 real_datetime(2024, 9, 18, 7, 50) real_datetime(2024, 9, 18, 7, 51)
 real_datetime(2024, 9, 18, 7, 52) real_datetime(2024, 9, 18, 7, 53)
 real_datetime(2024, 9, 18, 7, 54) real_datetime(2024, 9, 18, 7, 55)
 real_datetime(2024, 9, 18, 7, 56) real_datetime(2024, 9, 18, 7, 57)
 real_datetime(2024, 9, 18, 7, 58) real_datetime(2024, 9, 18, 7, 59)
 real_datetime(2024, 9, 18, 8, 0)]
As expected, the geocorona flag is set for 6 hours, from 02:00-08:00.
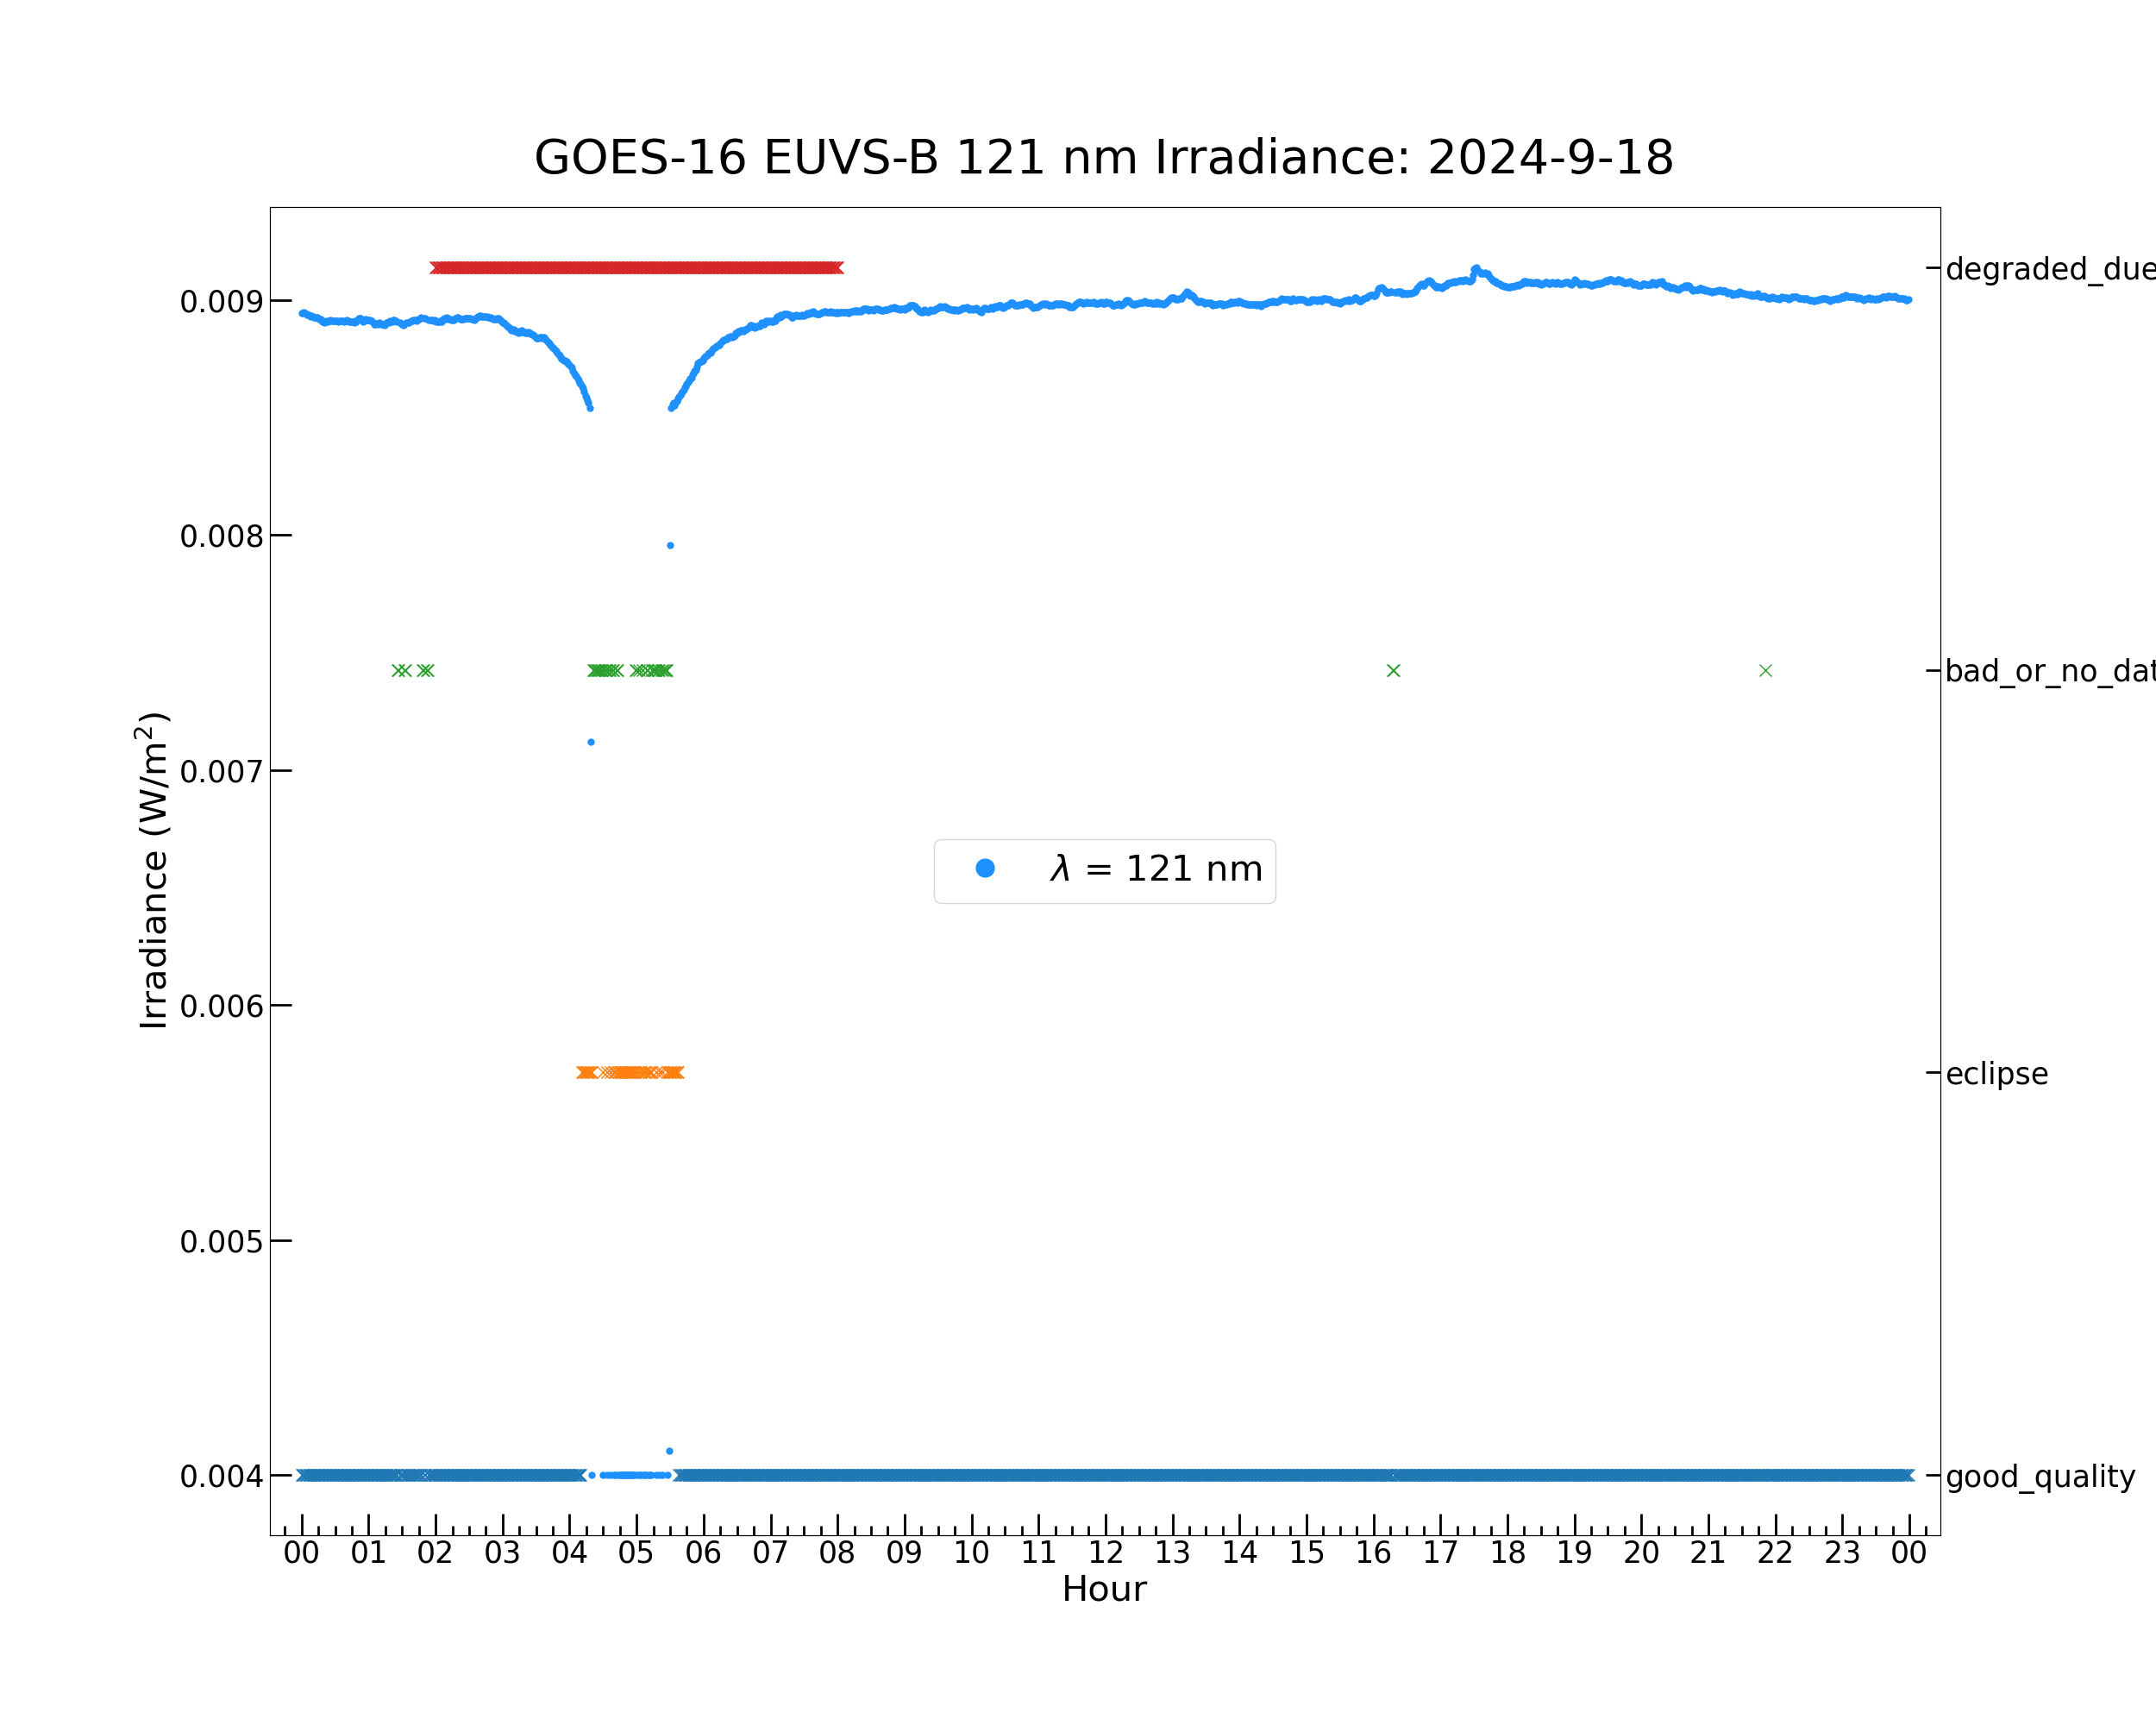
Now plot the EUVS-B 121 nm irradiance. The effects of the geocoronal absorption are significant, so the irradiance should be examined both with and without the geocorona flag excluded.
euvsb_121_irrad = np.ma.filled(euvs_data["irr_1216"][:], np.nan)
# Define an array of the EUVS-B 121 nm irradiance values and replace the missing and fill values in the irradiance with NaN values. The missing and fill values in the NetCDF data array are masked indices. The np.ma.filled() code is a simple way to replace the masked values with NaNs, which excludes them from plotting and numerical operations.

plt.figure(figsize = (25, 20))
plt.plot(euvs_timestamps, euvsb_121_irrad , color = 'dodgerblue', label = r'$\lambda$ = 121 nm', marker = '.', markersize = 10, linestyle \
         = 'none')
plt.rc('font', size = 25)
plt.xlabel('Hour', fontsize = 30)
plt.ylabel('Irradiance (W/m$^2$)', fontsize = 30)
plt.gca().xaxis.set_major_locator(mdates.HourLocator())
plt.gca().xaxis.set_major_formatter(mdates.DateFormatter('%H'))
plt.gca().xaxis.set_minor_locator(mdates.MinuteLocator([15, 30, 45]))
plt.gca().yaxis.set_minor_locator(tck.AutoMinorLocator(5))
plt.tick_params(axis = 'x', which = 'major', length = 18, width = 2, direction = 'in')
plt.tick_params(axis = 'x', which = 'minor', length = 8, width = 2, direction = 'in')
plt.tick_params(axis = 'y', which = 'major', length = 18, width = 2, direction = 'in')
plt.tick_params(axis = 'y', which = 'minor', length = 8, width = 2, direction = 'in')
plt.xticks(fontsize = 25, ha = 'center')
plt.yticks(fontsize = 25)
lg = plt.legend(loc = 'center', fontsize = 30, numpoints = 1)
lg.legend_handles[0].set_markersize(30)
plt.margins(0.02, 0.05)
plt.title('GOES-16 EUVS-B 121 nm Irradiance: ' + euvs_timestamps[0].strftime("%Y-%m-%d"), fontsize = 40, y = 1.02)
# Plot EUVS-B irradiance.

plt.twinx()
# Create a second x/y-axis pair to show the quality flags on a new y-axis on the right side of the plot.
# The x-axis is the same for both sets of data shown on the y-axes.

for i in euvsb_flags.flag_meanings:
# Loop over all EUVS-B quality flags.

    flag_set = euvsb_flags.get_flag(i)
    # Determine indices where current flag is and is not set.

    if np.any(flag_set):
        plt.plot(euvs_timestamps[flag_set], [i for _ in range(len(euvs_timestamps[flag_set]))], marker = 'x', linestyle = 'none', \
                 markersize = 10)
        plt.ylabel('Data Quality Flag ("x")', fontsize = 30)
        plt.yticks(fontsize = 25)
        plt.tick_params(axis = 'y', which = 'major', length = 12, width = 2, direction = 'in')
        plt.gca().xaxis.set_minor_locator(mdates.MinuteLocator([15, 30, 45]))
        plt.gca().xaxis.set_major_formatter(mdates.DateFormatter('%H'))
        plt.gca().xaxis.set_major_locator(mdates.HourLocator())
        # If the current flag is set anywhere, plot the flag at all timestamps where it is set.
plt.plot(euvs_timestamps[geocorona_flag_set], ['degraded_due_to_geocorona' for _ in range(len(euvs_timestamps[geocorona_flag_set]))], \
         marker = 'x', linestyle = 'none', markersize = 10)
# Plot quality flags on the right y-axis.
[<matplotlib.lines.Line2D object at 0x7f34292912b0>]
The irradiance dips in the penumbra are visible, and the eclipse is correctly flagged (‘eclipse’ flags in the penumbras and ‘bad_or_no_data’ flags in the umbra). The geocorona flag is set for the 6-hour period early in the day, overlapping the eclipse.
Now exclude the irradiance in the eclipse penumbra and examine the effects of the geocorona flag.
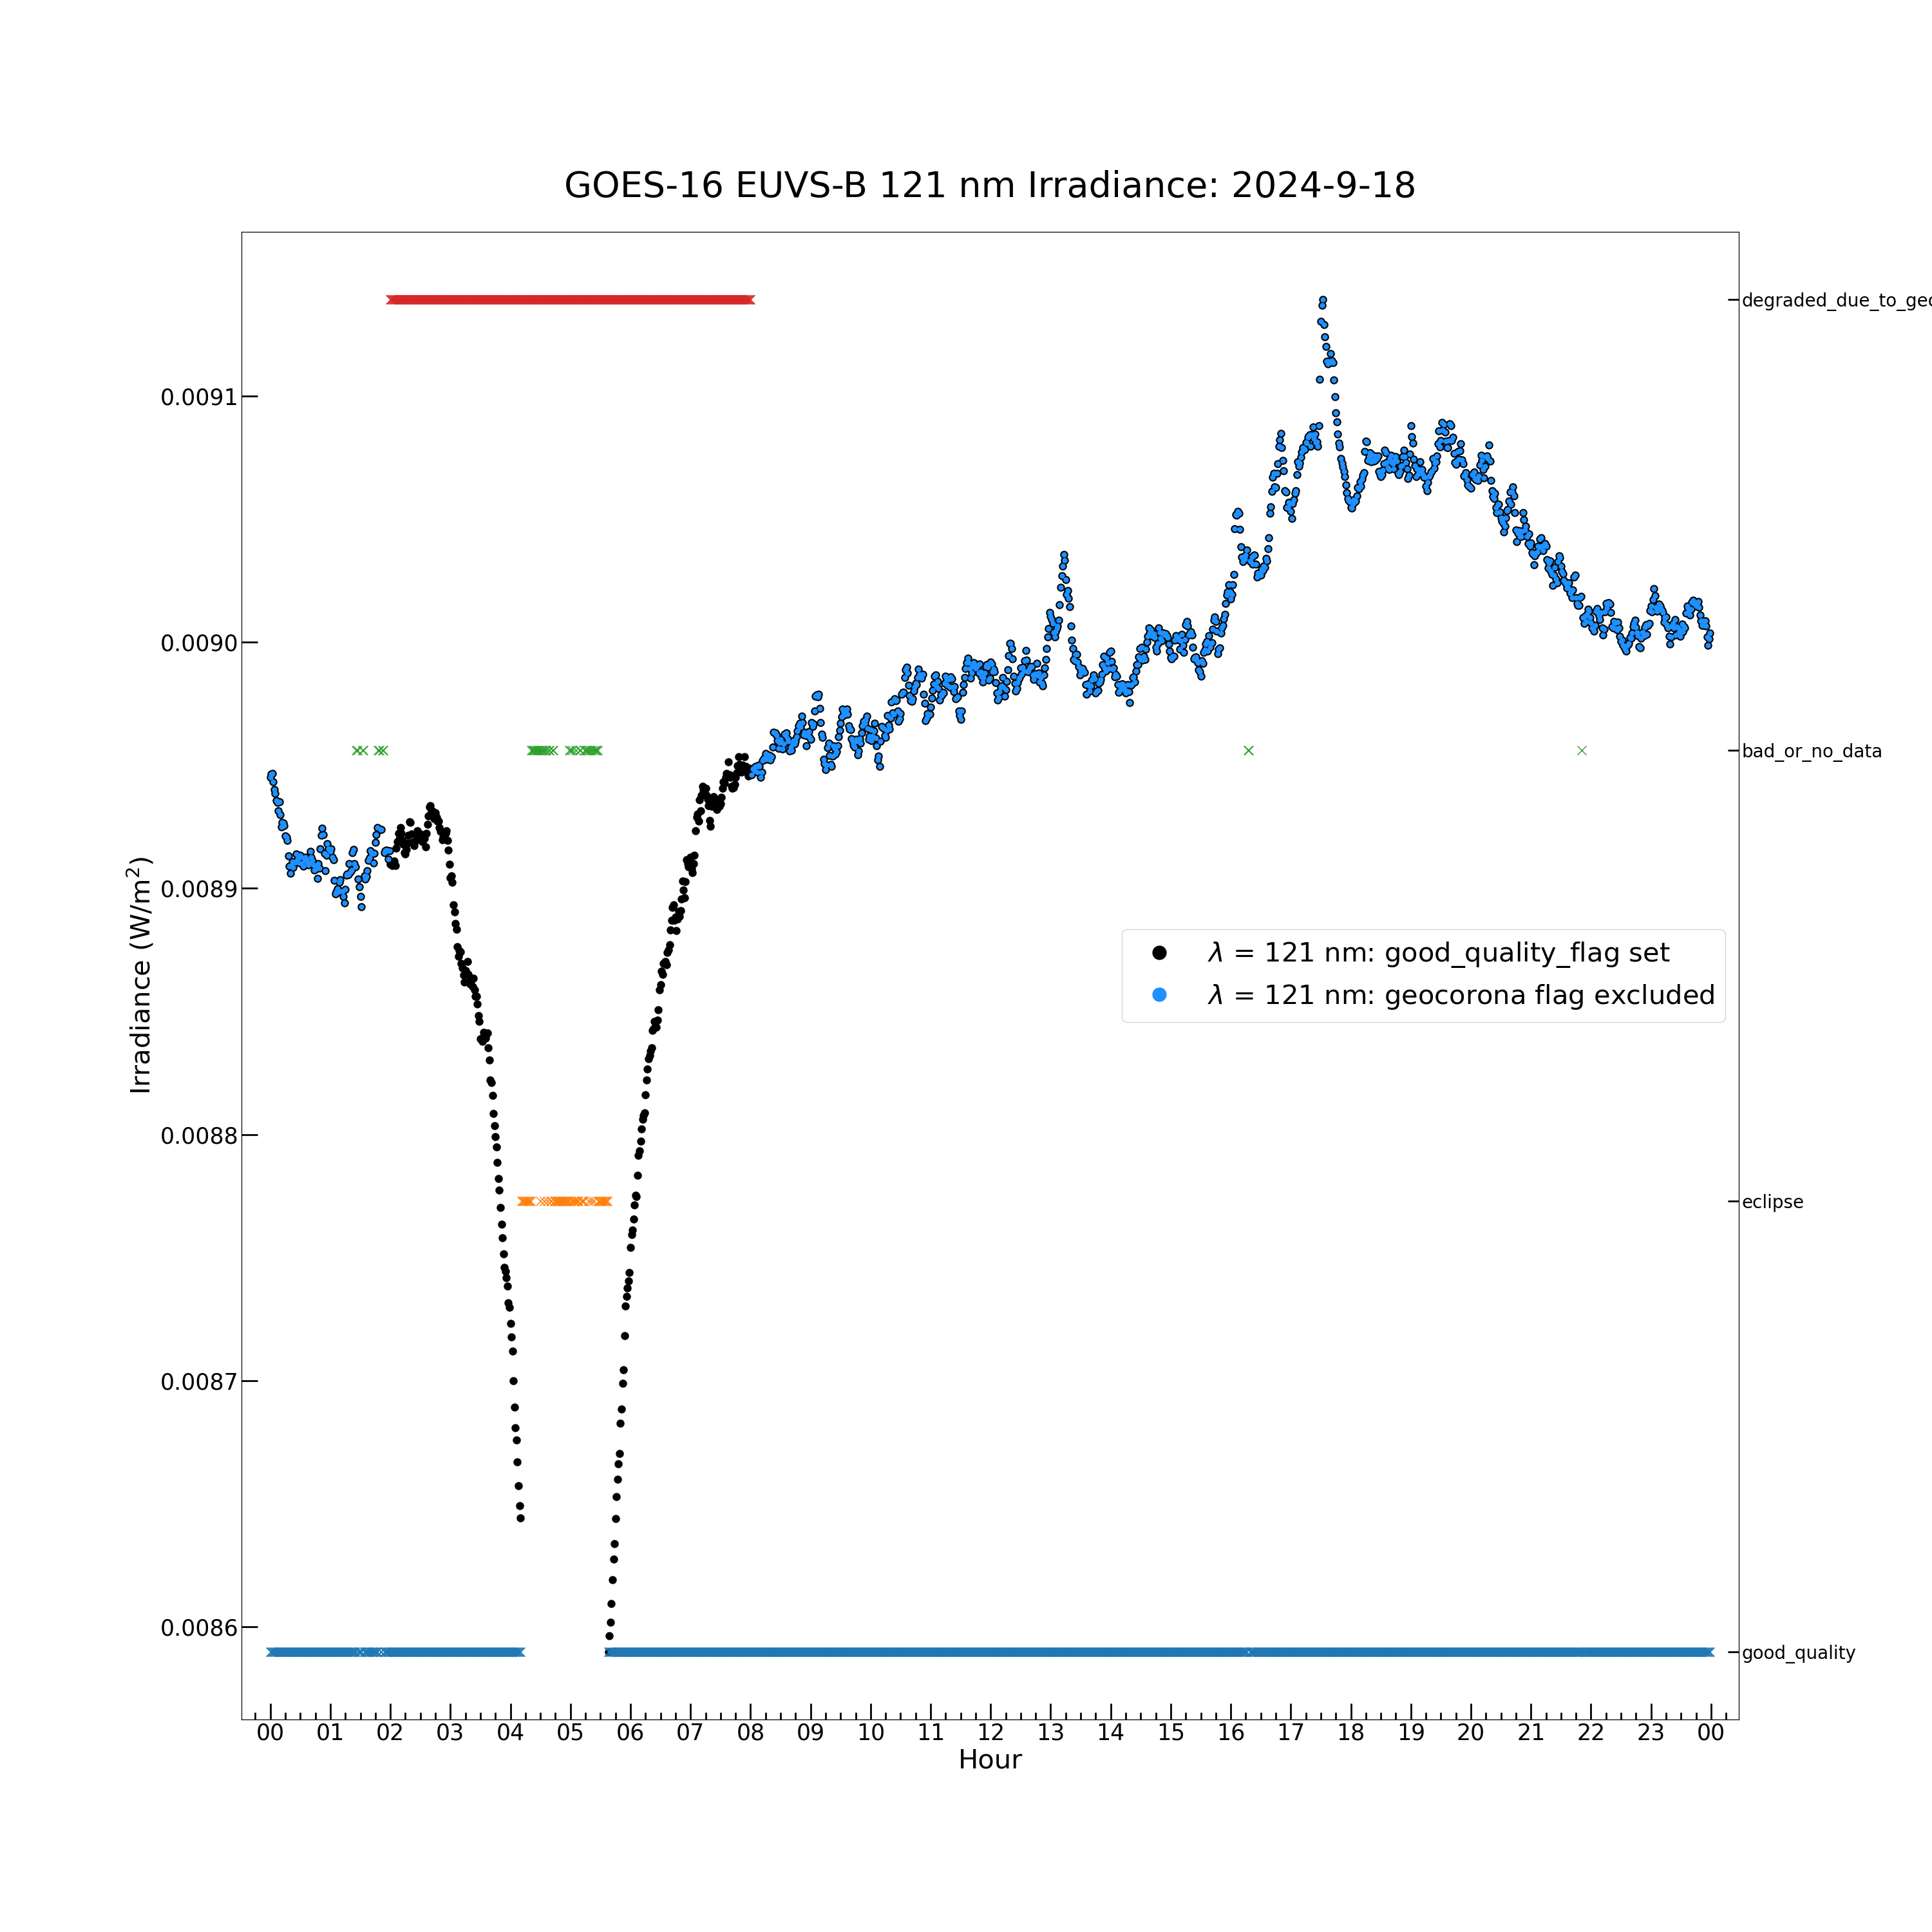
plt.figure(figsize = (30, 30))
plt.plot(euvs_timestamps[good_quality_flag], euvsb_121_irrad[good_quality_flag], color = 'black', label = \
         r'$\lambda$ = 121 nm: good_quality_flag set', marker = '.', markersize = 16, linestyle = 'none')
plt.plot(euvs_timestamps[~geocorona_flag_set], euvsb_121_irrad[~geocorona_flag_set], color = 'dodgerblue', label = \
         r'$\lambda$ = 121 nm: geocorona flag excluded', marker = '.', markersize = 10, linestyle = 'none')
plt.rc('font', size = 25)
plt.xlabel('Hour', fontsize = 30)
plt.ylabel('Irradiance (W/m$^2$)', fontsize = 30)
plt.gca().xaxis.set_major_locator(mdates.HourLocator())
plt.gca().xaxis.set_major_formatter(mdates.DateFormatter('%H'))
plt.gca().xaxis.set_minor_locator(mdates.MinuteLocator([15, 30, 45]))
plt.gca().yaxis.set_minor_locator(tck.AutoMinorLocator(5))
plt.tick_params(axis = 'x', which = 'major', length = 18, width = 2, direction = 'in')
plt.tick_params(axis = 'x', which = 'minor', length = 8, width = 2, direction = 'in')
plt.tick_params(axis = 'y', which = 'major', length = 18, width = 2, direction = 'in')
plt.tick_params(axis = 'y', which = 'minor', length = 8, width = 2, direction = 'in')
plt.xticks(fontsize = 25, ha = 'center')
plt.yticks(fontsize = 25)
lg = plt.legend(loc = 'center right', fontsize = 30, numpoints = 1)
lg.legend_handles[0].set_markersize(30)
lg.legend_handles[1].set_markersize(30)
plt.margins(0.02, 0.05)
plt.title('GOES-16 EUVS-B 121 nm Irradiance: ' + euvs_timestamps[0].strftime("%Y-%m-%d"), fontsize = 40, y = 1.02)
# Plot EUVS-B irradiance.

plt.twinx()
# Create a second x/y-axis pair to show the quality flags on a new y-axis on the right side of the plot.
# The x-axis is the same for both sets of data shown on the y-axes.

for i in euvsb_flags.flag_meanings:
# Loop over all EUVS-B quality flags.

    flag_set = euvsb_flags.get_flag(i)
    # Determine indices where current flag is and is not set.

    if np.any(flag_set):
        plt.plot(euvs_timestamps[flag_set], [i for _ in range(len(euvs_timestamps[flag_set]))], marker = 'x', linestyle = 'none', \
                 markersize = 10)
        plt.ylabel('Data Quality Flag ("x")', fontsize = 30)
        plt.yticks(fontsize = 20)
        plt.tick_params(axis = 'y', which = 'major', length = 12, width = 2, direction = 'in')
        plt.gca().xaxis.set_minor_locator(mdates.MinuteLocator([15, 30, 45]))
        plt.gca().xaxis.set_major_formatter(mdates.DateFormatter('%H'))
        plt.gca().xaxis.set_major_locator(mdates.HourLocator())
        # If the current flag is set anywhere, plot the flag at all timestamps where it is set.
plt.plot(euvs_timestamps[geocorona_flag_set], ['degraded_due_to_geocorona' for _ in range(len(euvs_timestamps[geocorona_flag_set]))], \
         marker = 'x', linestyle = 'none', markersize = 10)
# Plot quality flags on the right y-axis.
[<matplotlib.lines.Line2D object at 0x7f3429244f80>]
The geocoronal absorption causes a multi-hour dip in the irradiance before and after the eclipse.
EUVS-C Data
The EUVS-C variable contains the Mg II index. This is a ratio of the red & blue wings and h & k lines around 280 nm, in the UV region of the solar spectrum. First, print the EUVS-C data variables.
print(euvs_data["MgII_EXIS"])
print('')
print(euvs_data["MgII_standard"])
<class 'netCDF4.Variable'>
float32 MgII_EXIS(time)
    long_name: Average Mg II index from EXIS measurements.
    _FillValue: -9999.0
    valid_min: 0.0
    valid_max: 1.0
unlimited dimensions: time
current shape = (1440,)
filling off

<class 'netCDF4.Variable'>
float32 MgII_standard(time)
    long_name: Average EXIS Mg II index scaled to a standard Mg II measurement resolution.
    _FillValue: -9999.0
    valid_min: 0.0
    valid_max: 1.0
unlimited dimensions: time
current shape = (1440,)
filling off
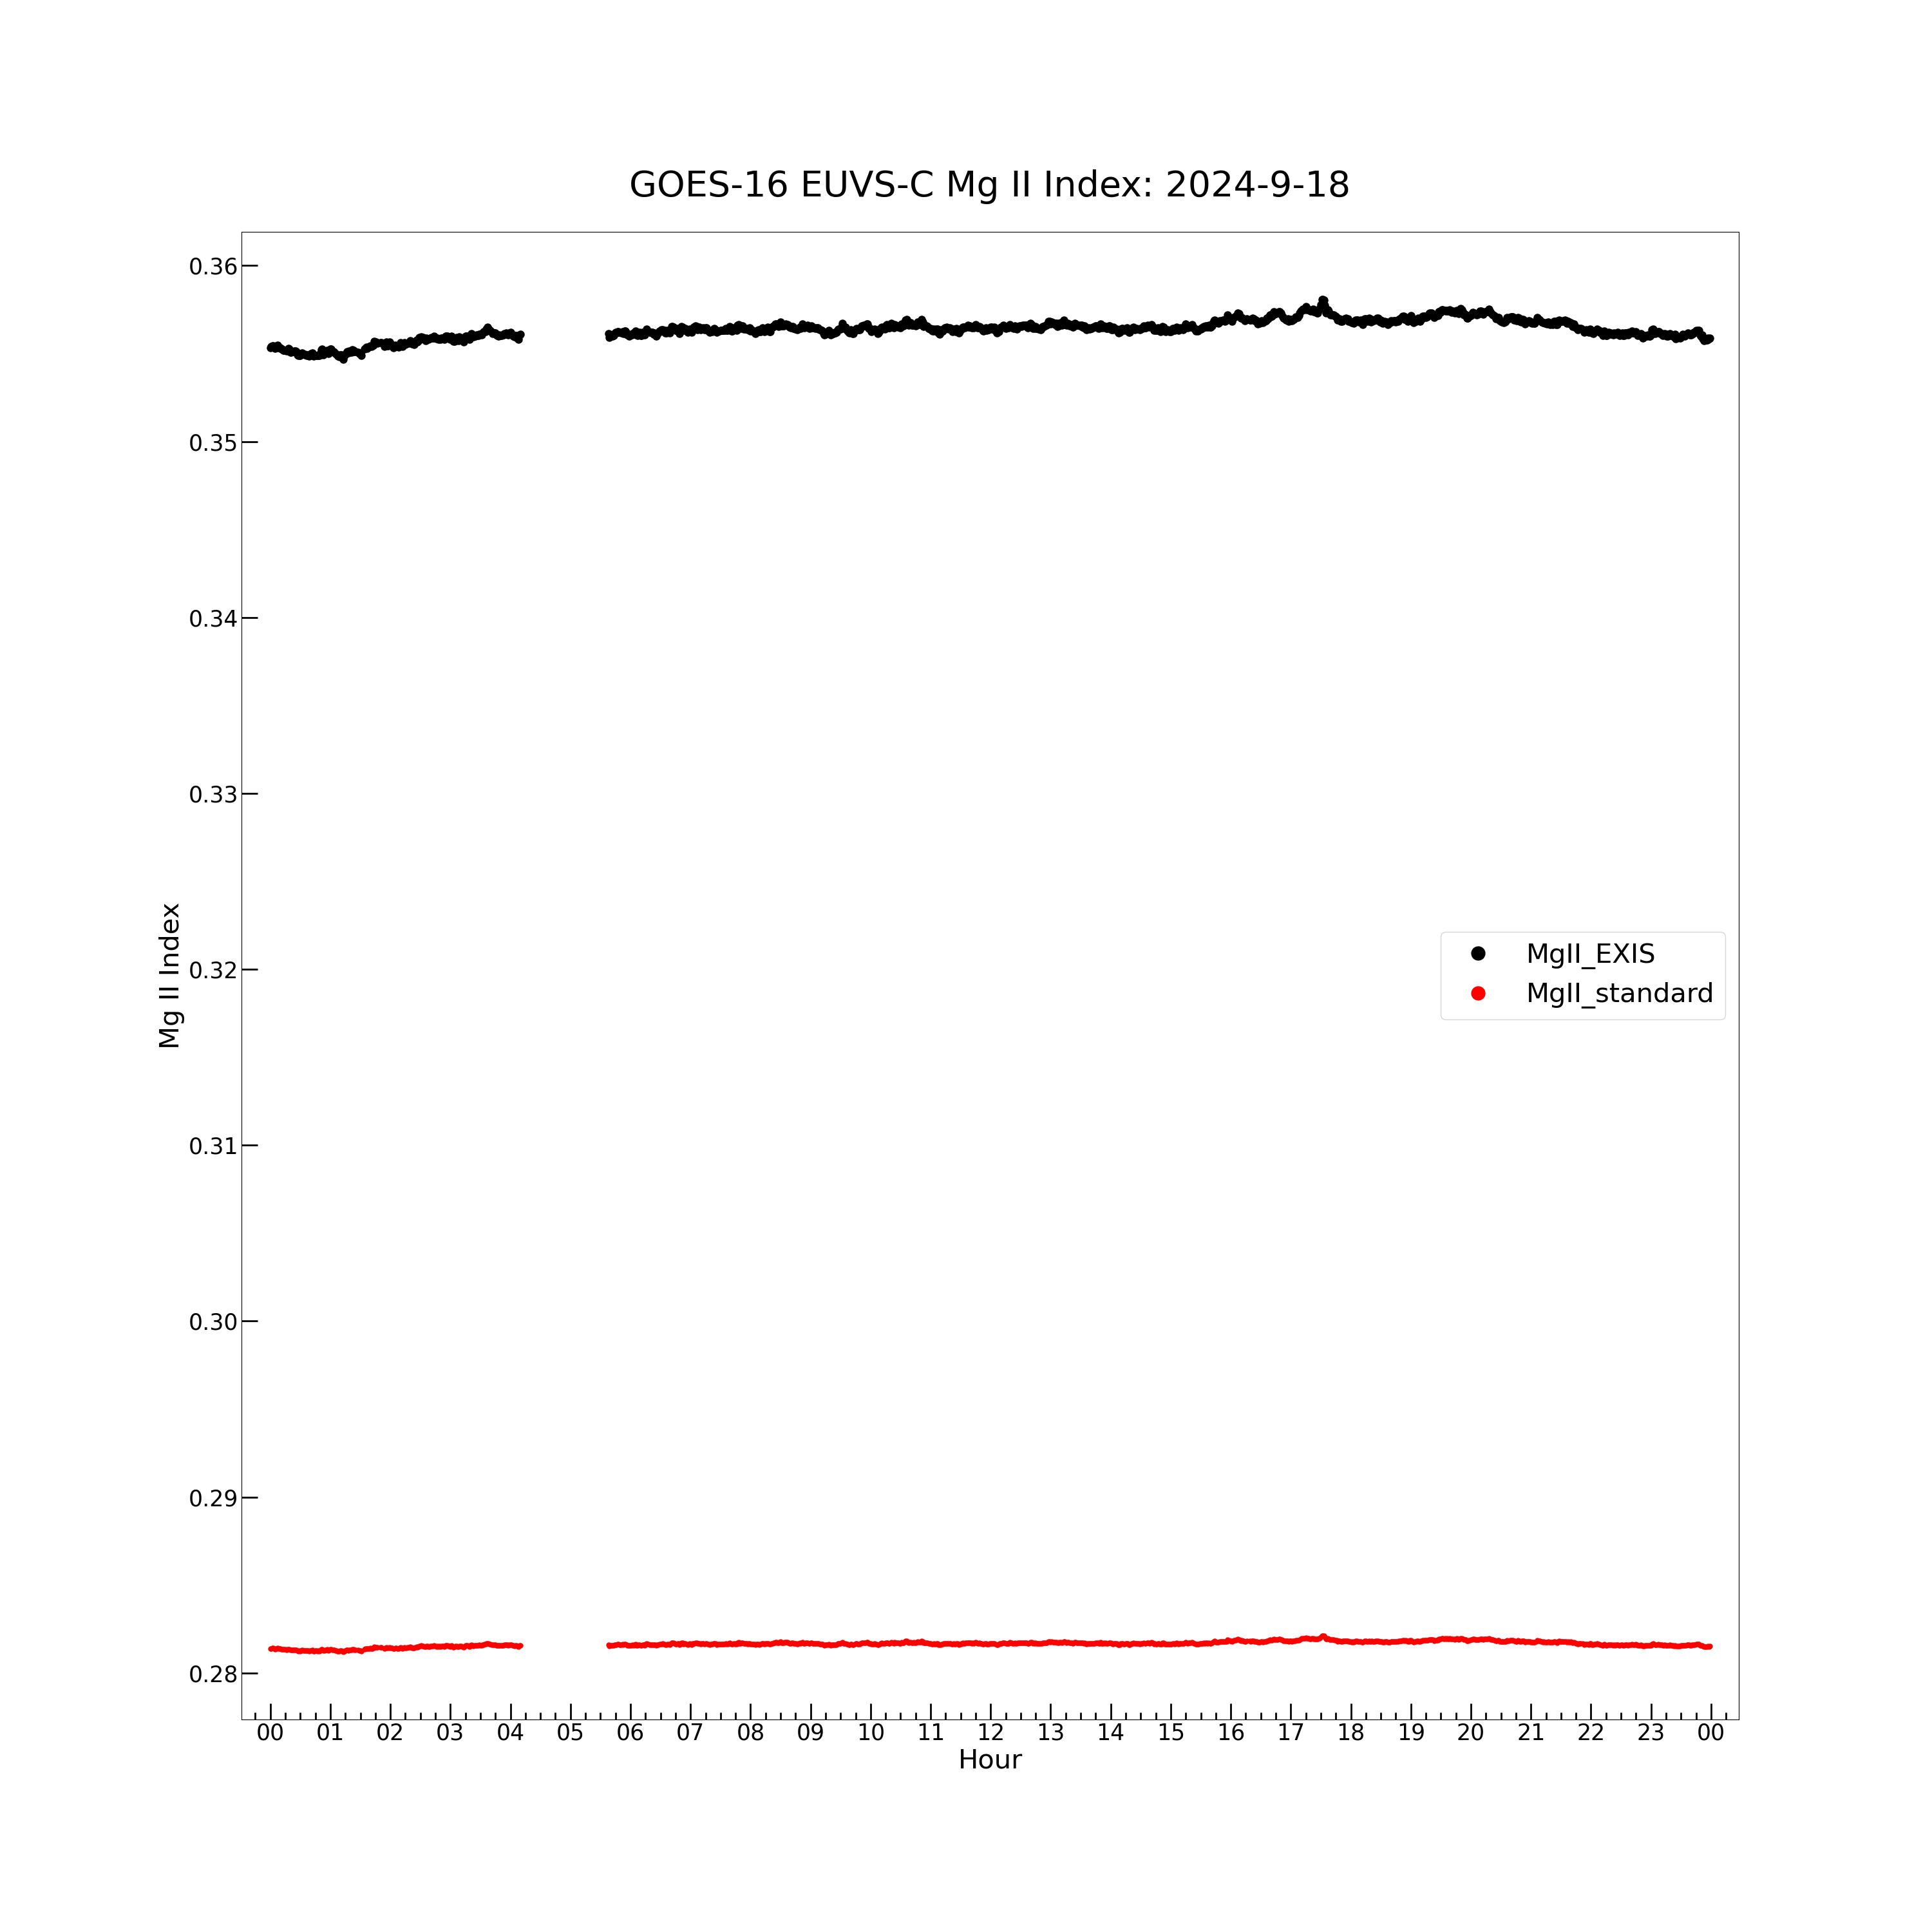
The ‘MgII_EXIS’ variable contains the Mg II index as measured by the satellite. The “MgII_standard” variable also contains the Mg II index, but linearly scaled to a standard resolution. This ensures that the Mg II data from the different GOES satellites matches when compared directly.
Now print the EUVS-C data quality flag variables.
print(euvs_data["MgII_flag"])
print('')
print(euvs_data["MgII_flag_excluded"])
<class 'netCDF4.Variable'>
uint8 MgII_flag(time)
    long_name: Flag for Mg II index.
    _FillValue: 255
    flag_masks: [7 1 2 4]
    flag_values: [0 1 2 4]
    flag_meanings: good_quality eclipse lunar_transit bad_or_no_data
unlimited dimensions: time
current shape = (1440,)
filling off

<class 'netCDF4.Variable'>
uint8 MgII_flag_excluded(time)
    long_name: Flags for values excluded from the calculation of Mg II index.
    _FillValue: 255
    flag_masks: [ 1  2  4  8 16 32 64]
    flag_values: [ 1  2  4  8 16 32 64]
    flag_meanings: pointing_error off_point temperature_error data_quality_error invalid_mode missing_data L0_error
unlimited dimensions: time
current shape = (1440,)
filling off
The ‘MgII_flag’ variable contains the same data quality flags as the EUVS-A and EUVS-B data. The ‘MgII_flag_excluded’ variable contains different quality flags specific to EUVS-C.
euvsc_flag_1 = ncflag.FlagWrap.init_from_netcdf(euvs_data["MgII_flag"])
euvsc_flag_2 = ncflag.FlagWrap.init_from_netcdf(euvs_data["MgII_flag_excluded"])

print(euvsc_flag_1.flag_meanings)
print('')
print(euvsc_flag_2.flag_meanings)

print('Number of indices at which the EUVS-C quality flags are set:')
for m in euvsc_flag_1.flag_meanings:
# Loop over all the indices in the flag_meanings array of the euvsc_flag_1 object.

    flag_set = euvsc_flag_1.get_flag(m)
    # Determine indices where the current flag is and is not set. Every index is assigned a Boolean value:
    # True means the flag is set, False means the flag is not set.

    flag_frequency = np.count_nonzero(flag_set)
    print(f"{m:<18}: {flag_frequency}")
    # Print the number of indices at which each flag is set.
for n in euvsc_flag_2.flag_meanings:
# Loop over all the indices in the flag_meanings array of the euvsc_flag_2 object.

    flag_set = euvsc_flag_2.get_flag(n)
    # Determine indices where the current flag is and is not set. Every index is assigned a Boolean value:
    # True means the flag is set, False means the flag is not set.

    flag_frequency = np.count_nonzero(flag_set)
    print(f"{n:<18}: {flag_frequency}")
    # Print the number of indices at which each flag is set.
['good_quality', 'eclipse', 'lunar_transit', 'bad_or_no_data']

['pointing_error', 'off_point', 'temperature_error', 'data_quality_error', 'invalid_mode', 'missing_data', 'L0_error']
Number of indices at which the EUVS-C quality flags are set:
good_quality      : 1342
eclipse           : 19
lunar_transit     : 0
bad_or_no_data    : 79
pointing_error    : 0
off_point         : 14
temperature_error : 0
data_quality_error: 0
invalid_mode      : 16
missing_data      : 0
L0_error          : 0
The EUVS-C data shows the same eclipse flags as EUVS-A and EUVS-B, which is expected.
Because there are 2 flag variables for EUVS-C, separate sets of flag indices must be determined.
good_quality_flag = euvsc_flag_1.get_flag('good_quality')
invalid_mode_flag = euvsc_flag_2.get_flag('invalid_mode')
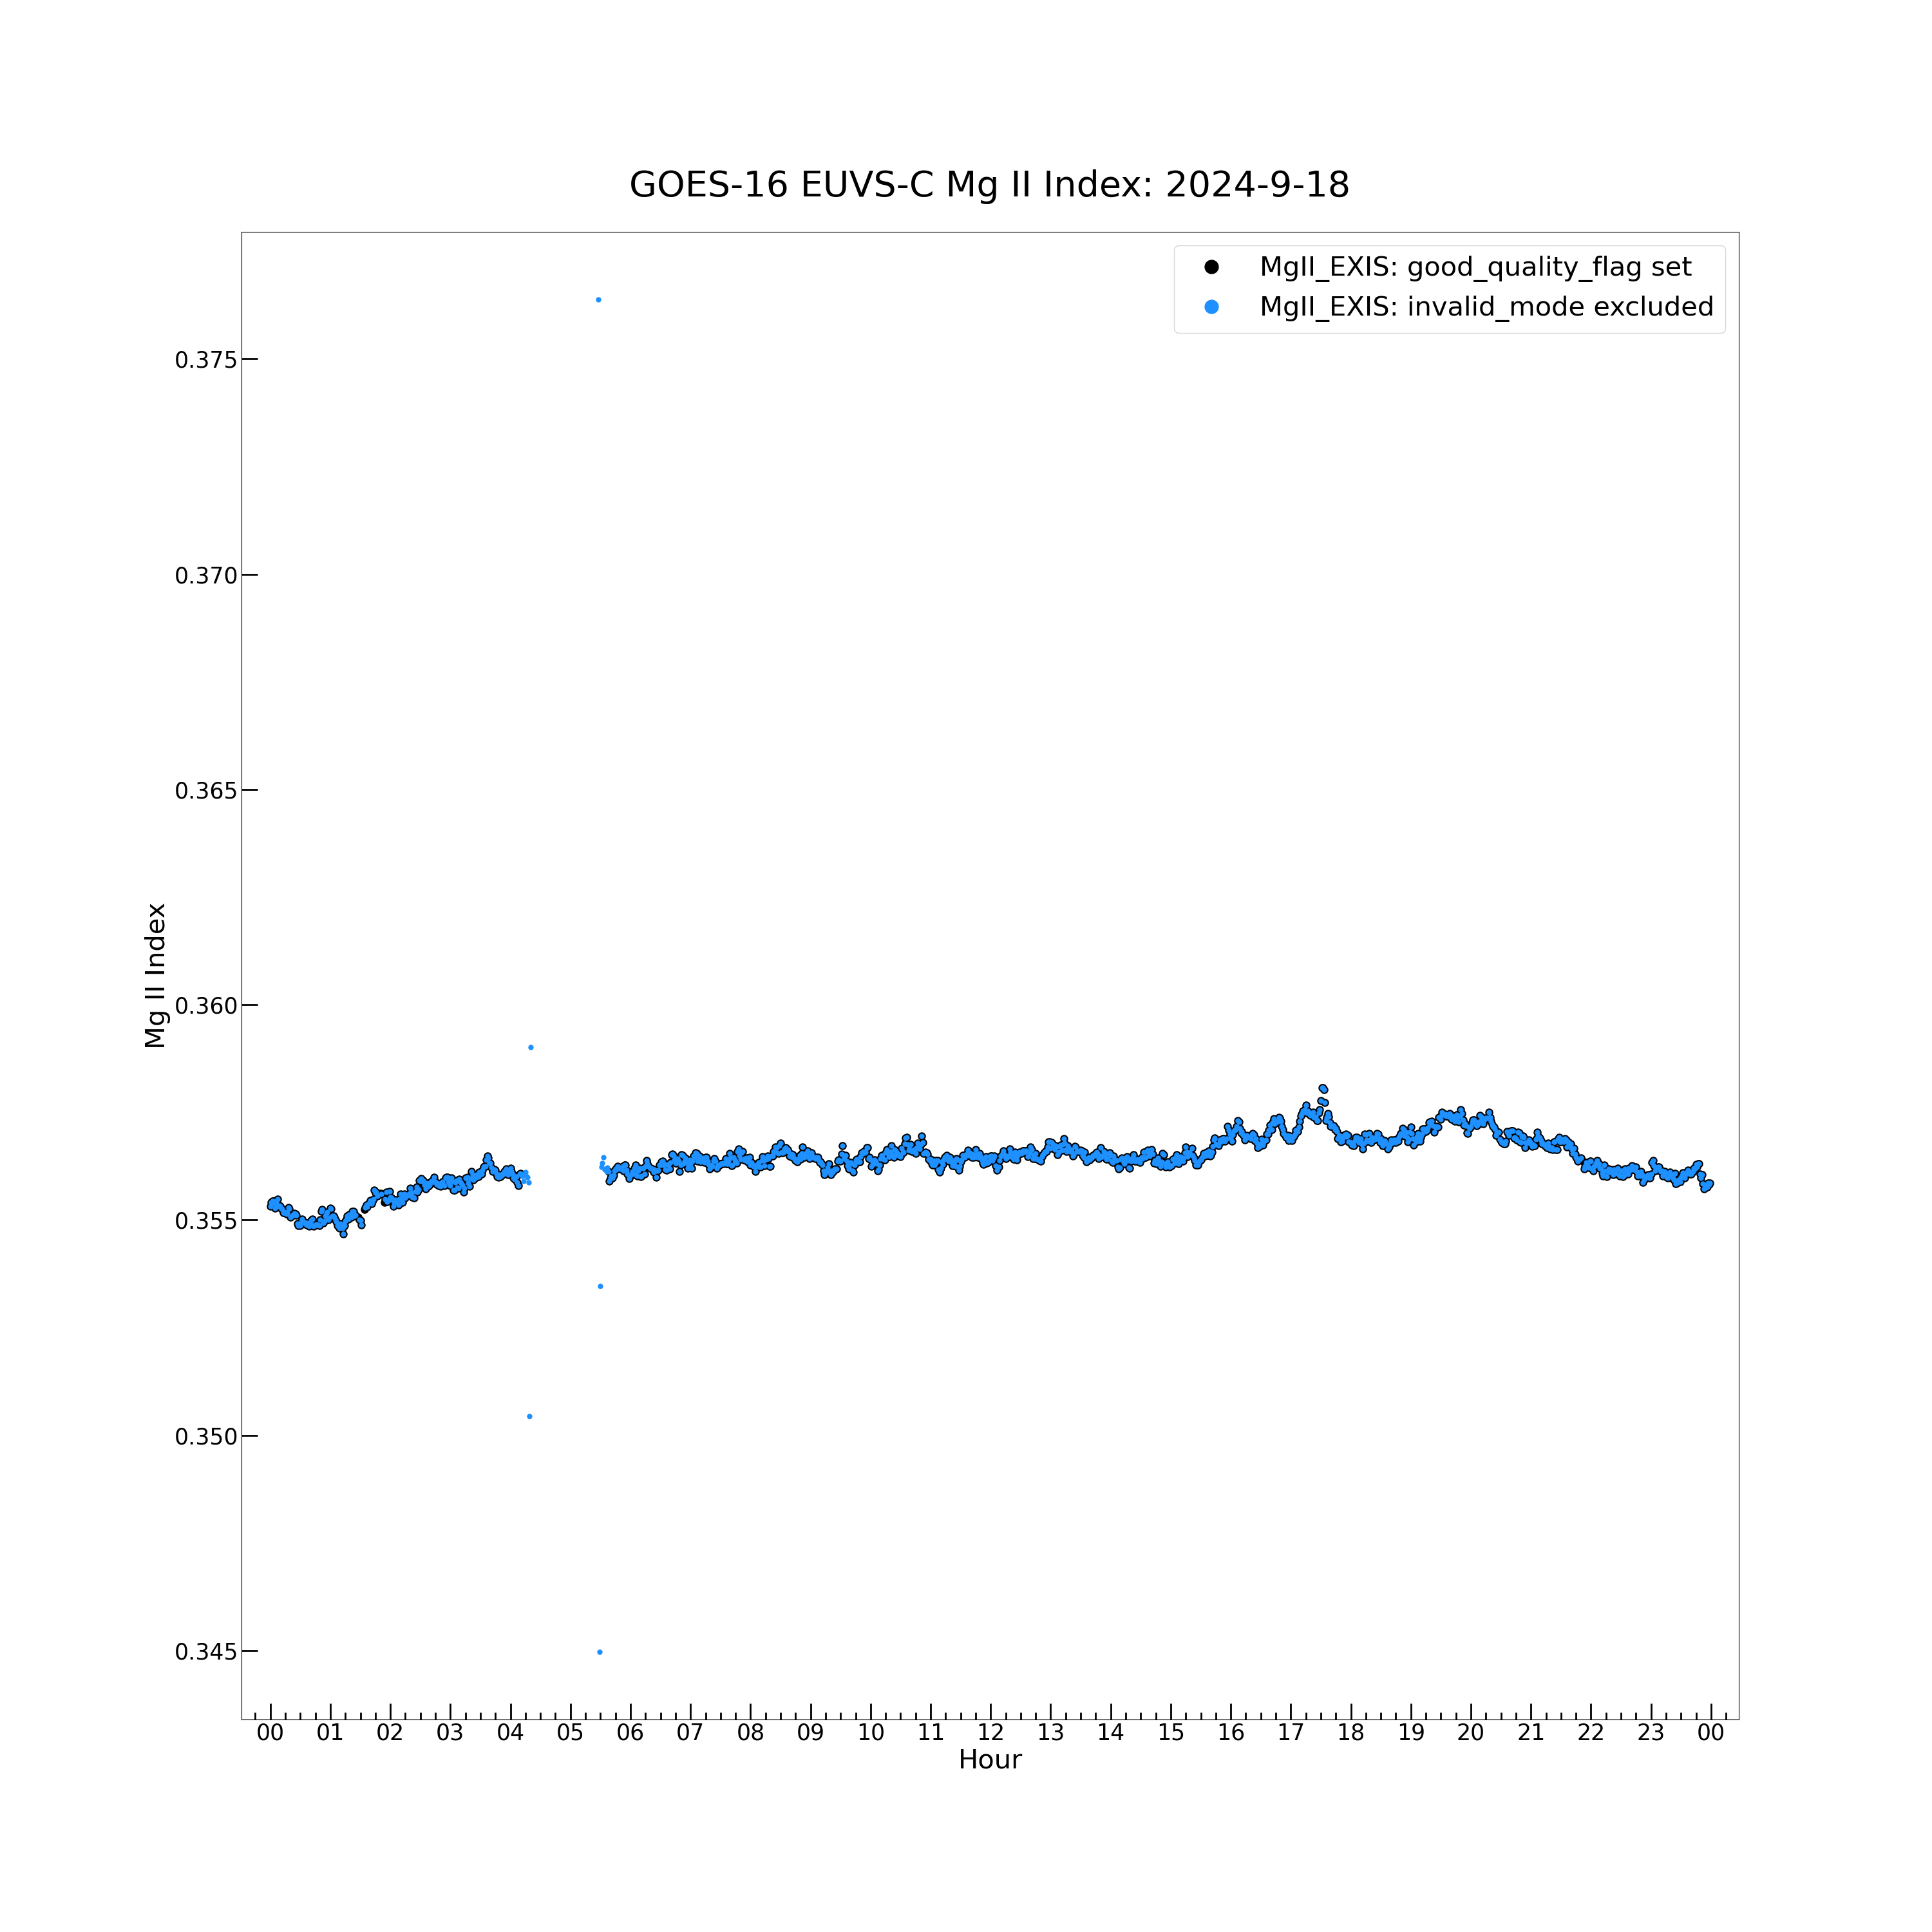
Now plot the EUVS-C data and quality flags. First, plot the MgII EXIS (unscaled) values.
euvsc_mgii_exis = np.ma.filled(euvs_data["MgII_EXIS"][:], np.nan)
euvsc_mgii_standard = np.ma.filled(euvs_data["MgII_standard"][:], np.nan)
# Define arrays of the EUVS-C Mg II values and replace the missing and fill values in the data with NaN values. The missing and fill values in the NetCDF data array are masked indices. The np.ma.filled() code is a simple way to replace the masked values with NaNs, which excludes them from plotting and numerical operations.

plt.figure(figsize = (30, 30))
plt.plot(euvs_timestamps[good_quality_flag], euvsc_mgii_exis[good_quality_flag], color = 'black', label = \
         'MgII_EXIS: good_quality_flag set', marker = '.', markersize = 16, linestyle = 'none')
plt.plot(euvs_timestamps[~invalid_mode_flag], euvsc_mgii_exis[~invalid_mode_flag], color = 'dodgerblue', label = \
         'MgII_EXIS: invalid_mode excluded', marker = '.', markersize = 10, linestyle = 'none')
plt.rc('font', size = 25)
plt.xlabel('Hour', fontsize = 30)
plt.ylabel('Mg II Index', fontsize = 30)
plt.gca().xaxis.set_major_locator(mdates.HourLocator())
plt.gca().xaxis.set_major_formatter(mdates.DateFormatter('%H'))
plt.gca().xaxis.set_minor_locator(mdates.MinuteLocator([15, 30, 45]))
plt.gca().yaxis.set_minor_locator(tck.AutoMinorLocator(4))
plt.tick_params(axis = 'x', which = 'major', length = 18, width = 2, direction = 'in')
plt.tick_params(axis = 'x', which = 'minor', length = 8, width = 2, direction = 'in')
plt.tick_params(axis = 'y', which = 'major', length = 18, width = 2, direction = 'in')
plt.tick_params(axis = 'y', which = 'minor', length = 8, width = 2, direction = 'in')
plt.xticks(fontsize = 25, ha = 'center')
plt.yticks(fontsize = 25)
lg = plt.legend(loc = 'best', fontsize = 30, numpoints = 1)
lg.legend_handles[0].set_markersize(30)
lg.legend_handles[1].set_markersize(30)
plt.margins(0.02, 0.05)
plt.title('GOES-16 EUVS-C Mg II Index: ' + euvs_timestamps[0].strftime("%Y-%m-%d"), fontsize = 40, y = 1.02)
# Plot EUVS-C data.
Text(0.5, 1.02, 'GOES-16 EUVS-C Mg II Index: 2024-09-18')
Even with the data excluded where the invalid_mode flag is set, there are some outlying points.
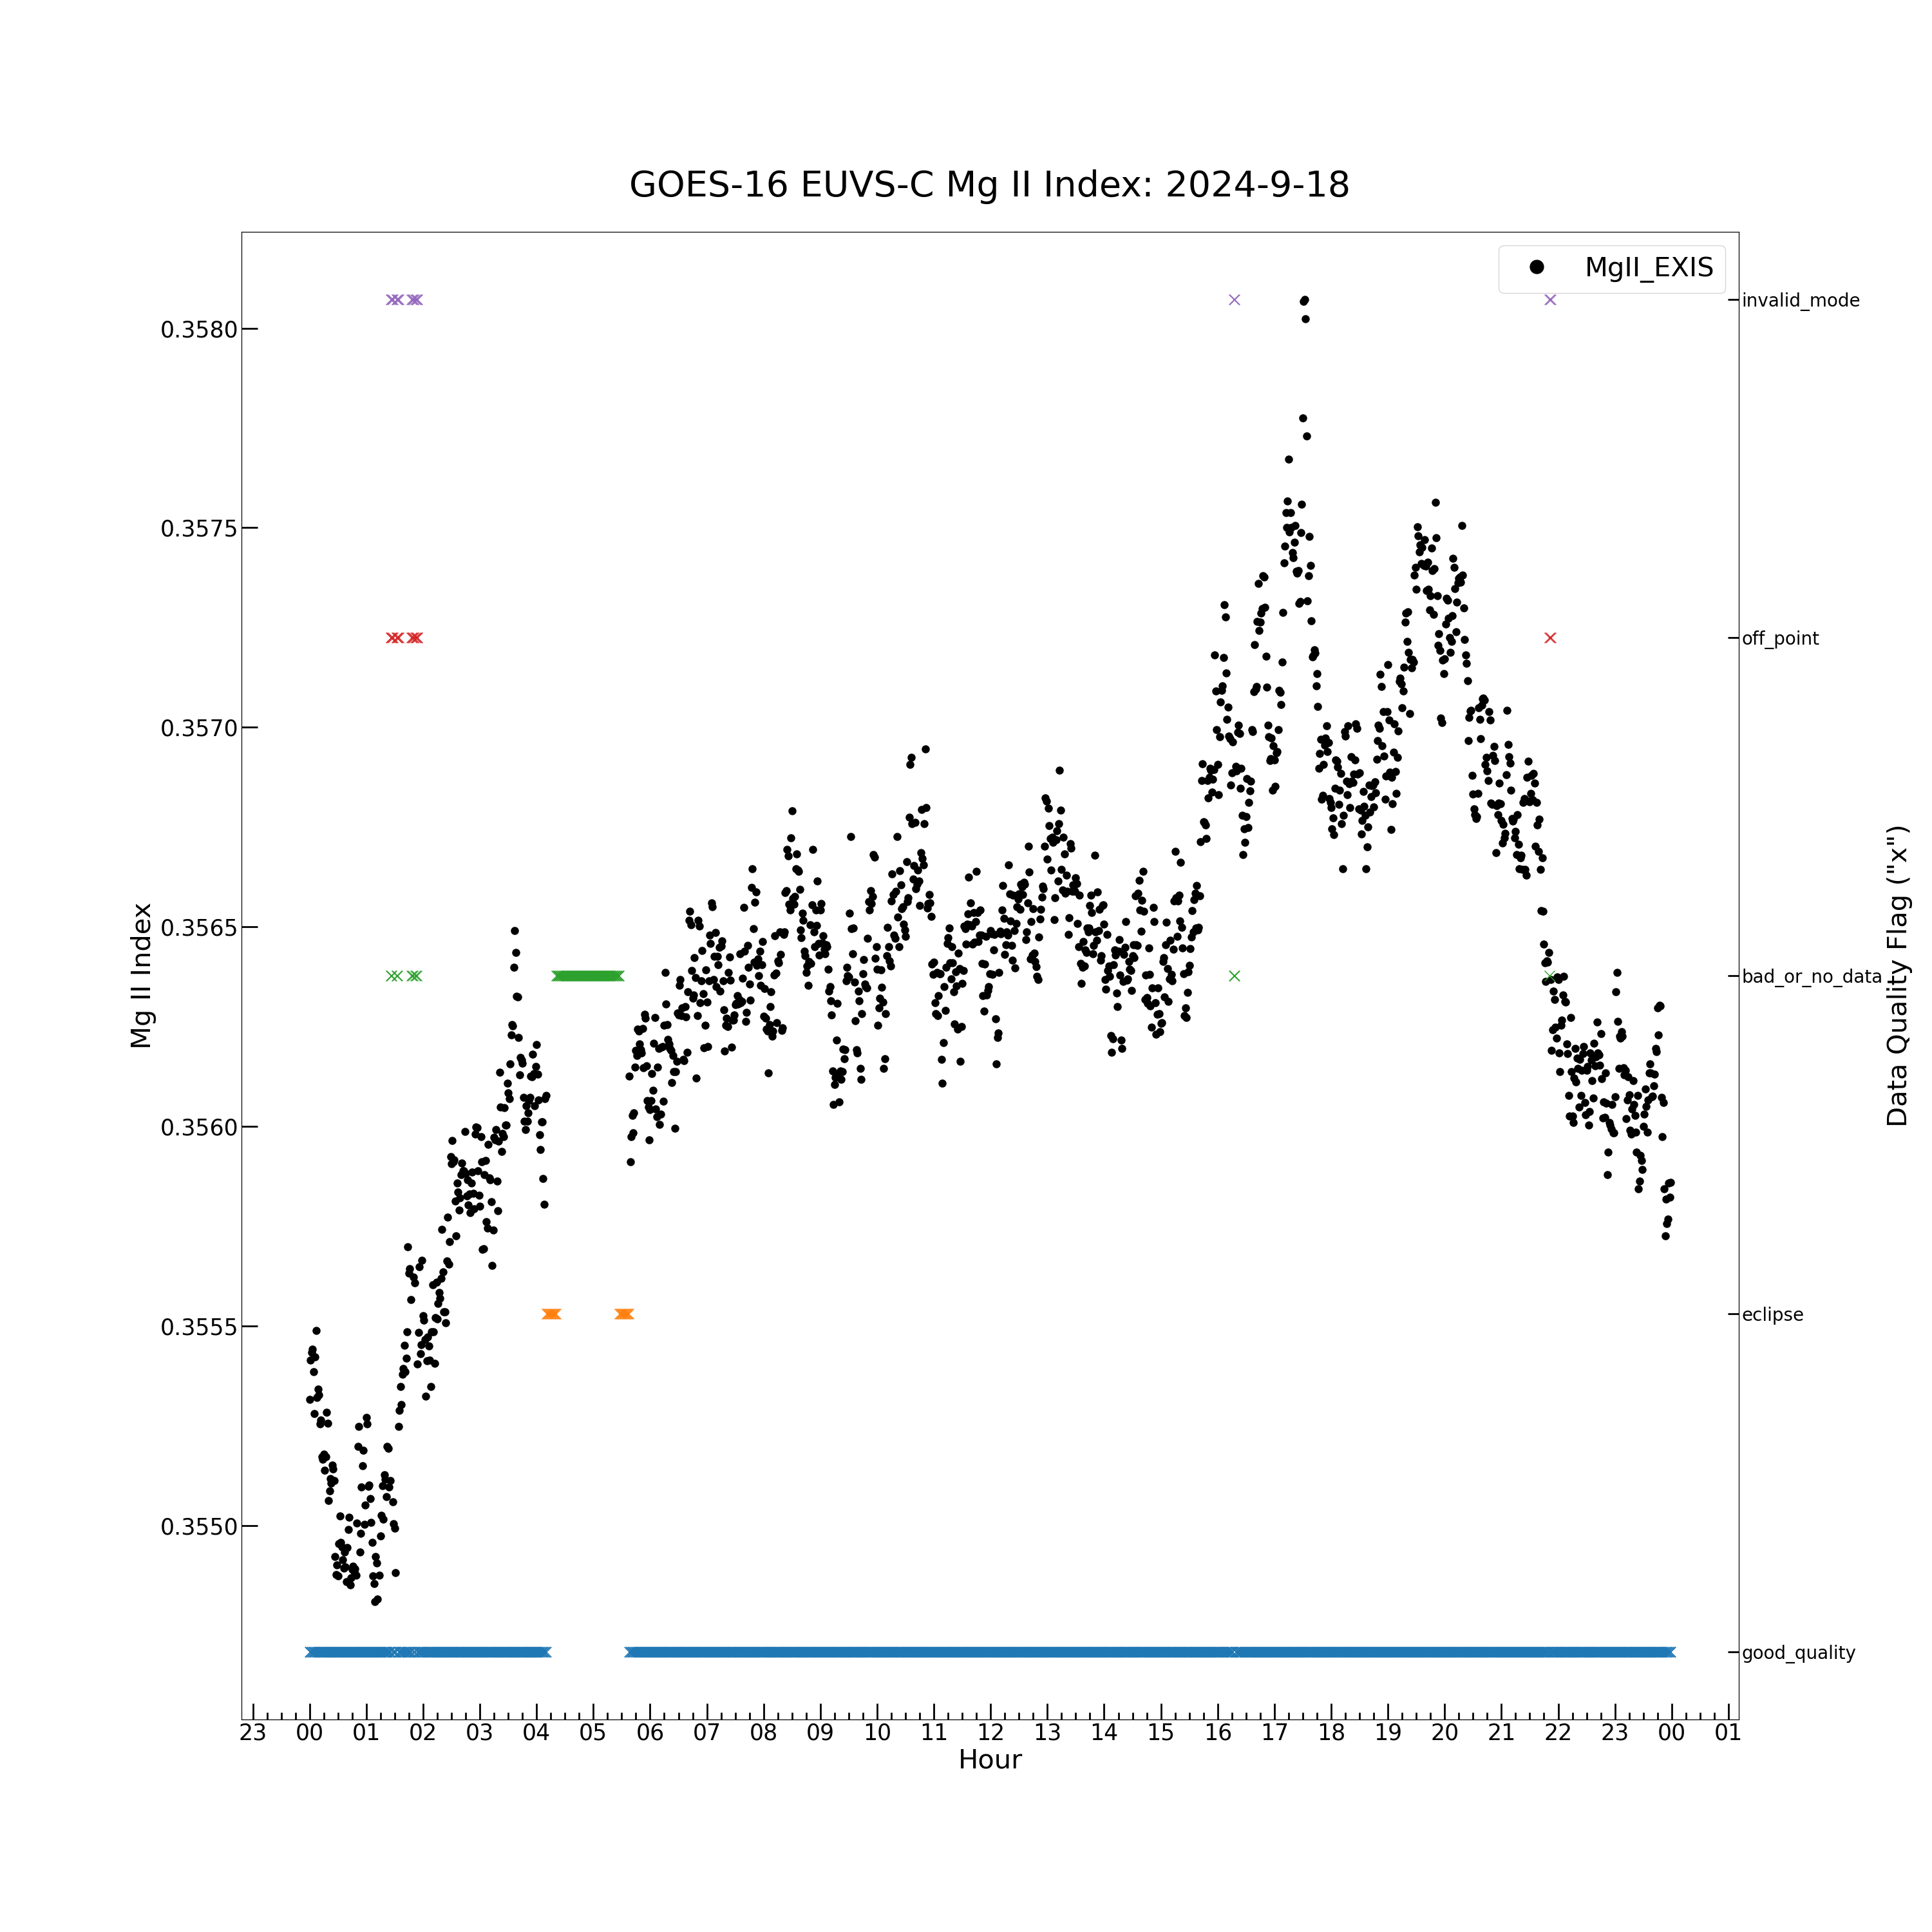
plt.figure(figsize = (30, 30))
plt.plot(euvs_timestamps[good_quality_flag], euvsc_mgii_exis[good_quality_flag], color = 'black', label = 'MgII_EXIS', marker = '.', \
         markersize = 16, linestyle = 'none')
plt.rc('font', size = 25)
plt.xlabel('Hour', fontsize = 30)
plt.ylabel('Mg II Index', fontsize = 30)
plt.gca().xaxis.set_major_locator(mdates.HourLocator())
plt.gca().xaxis.set_major_formatter(mdates.DateFormatter('%H'))
plt.gca().xaxis.set_minor_locator(mdates.MinuteLocator([15, 30, 45]))
plt.gca().yaxis.set_minor_locator(tck.AutoMinorLocator(5))
plt.tick_params(axis = 'x', which = 'major', length = 18, width = 2, direction = 'in')
plt.tick_params(axis = 'x', which = 'minor', length = 8, width = 2, direction = 'in')
plt.tick_params(axis = 'y', which = 'major', length = 18, width = 2, direction = 'in')
plt.tick_params(axis = 'y', which = 'minor', length = 8, width = 2, direction = 'in')
plt.xticks(fontsize = 25, ha = 'center')
plt.yticks(fontsize = 25)
lg = plt.legend(loc = 'upper right', fontsize = 30, numpoints = 1)
lg.legend_handles[0].set_markersize(30)
plt.margins(0.02, 0.05)
plt.title('GOES-16 EUVS-C Mg II Index: ' + euvs_timestamps[0].strftime("%Y-%m-%d"), fontsize = 40, y = 1.02)
# Plot EUVS-C data.

plt.twinx()
# Create a second x/y-axis pair to show the quality flags on a new y-axis on the right side of the plot.
# The x-axis is the same for both sets of data shown on the y-axes.

for j in euvsc_flag_1.flag_meanings:
# Loop over all EUVS-C quality flags in the MgII_flag variable.

    flag_set = euvsc_flag_1.get_flag(j)
    # Determine indices where current flag is and is not set.

    if np.any(flag_set):
        plt.plot(euvs_timestamps[flag_set], [j for _ in range(len(euvs_timestamps[flag_set]))], marker = 'x', linestyle = 'none', \
                 markersize = 12)
        plt.ylabel('Data Quality Flag ("x")', fontsize = 30)
        plt.yticks(fontsize = 20)
        plt.tick_params(axis = 'y', which = 'major', length = 12, width = 2, direction = 'in')
        plt.gca().xaxis.set_minor_locator(mdates.MinuteLocator([15, 30, 45]))
        plt.gca().xaxis.set_major_formatter(mdates.DateFormatter('%H'))
        plt.gca().xaxis.set_major_locator(mdates.HourLocator())
        # If the current flag is set anywhere, plot the flag at all timestamps where it is set.

for k in euvsc_flag_2.flag_meanings:
# Loop over all EUVS-C quality flags in the MgII_flag_excluded variable.

    flag_set = euvsc_flag_2.get_flag(k)
    # Determine indices where current flag is and is not set.

    if np.any(flag_set):
        plt.plot(euvs_timestamps[flag_set], [k for _ in range(len(euvs_timestamps[flag_set]))], marker = 'x', linestyle = 'none', \
                 markersize = 12)
        plt.ylabel('Data Quality Flag ("x")', fontsize = 30)
        plt.yticks(fontsize = 20)
        plt.tick_params(axis = 'y', which = 'major', length = 12, width = 2, direction = 'in')
        plt.gca().xaxis.set_minor_locator(mdates.MinuteLocator([15, 30, 45]))
        plt.gca().xaxis.set_major_formatter(mdates.DateFormatter('%H'))
        plt.gca().xaxis.set_major_locator(mdates.HourLocator())
        # If the current flag is set anywhere, plot the flag at all timestamps where it is set.
Now plot the MgII_EXIS and MgII_standard data to see the effects of the Mg II linear scaling.
plt.figure(figsize = (30, 30))
plt.plot(euvs_timestamps[good_quality_flag], euvsc_mgii_exis[good_quality_flag], color = 'black', label = 'MgII_EXIS', marker = '.', \
         markersize = 16, linestyle = 'none')
plt.plot(euvs_timestamps[good_quality_flag], euvsc_mgii_standard[good_quality_flag], color = 'red', label = 'MgII_standard', marker = '.', \
         markersize = 10, linestyle = 'none')
plt.rc('font', size = 25)
plt.xlabel('Hour', fontsize = 30)
plt.ylabel('Mg II Index', fontsize = 30)
plt.gca().xaxis.set_major_locator(mdates.HourLocator())
plt.gca().xaxis.set_major_formatter(mdates.DateFormatter('%H'))
plt.gca().xaxis.set_minor_locator(mdates.MinuteLocator([15, 30, 45]))
plt.gca().yaxis.set_minor_locator(tck.AutoMinorLocator(5))
plt.tick_params(axis = 'x', which = 'major', length = 18, width = 2, direction = 'in')
plt.tick_params(axis = 'x', which = 'minor', length = 8, width = 2, direction = 'in')
plt.tick_params(axis = 'y', which = 'major', length = 18, width = 2, direction = 'in')
plt.tick_params(axis = 'y', which = 'minor', length = 8, width = 2, direction = 'in')
plt.xticks(fontsize = 25, ha = 'center')
plt.yticks(fontsize = 25)
lg = plt.legend(loc = 'center right', fontsize = 30, numpoints = 1)
lg.legend_handles[0].set_markersize(30)
lg.legend_handles[1].set_markersize(30)
plt.margins(0.02, 0.05)
plt.title('GOES-16 EUVS-C Mg II Index: ' + euvs_timestamps[0].strftime("%Y-%m-%d"), fontsize = 40, y = 1.02)
# Plot EUVS-C data.
Text(0.5, 1.02, 'GOES-16 EUVS-C Mg II Index: 2024-09-18')
EUVSPEC Irradiance
The EUV model spectrum is calculated using all the irradiance measurements from the EXIS instrument: EUVS-A, EUVS-B, EUVS-C and XRS.
First, print the EUVSPEC irradiance and quality flag variable descriptions.
print(euvs_data["model_irradiance_spectrum"])
print('')
print(euvs_data["model_case_flag"])
<class 'netCDF4.Variable'>
float32 model_irradiance_spectrum(time, wavelength_bin)
    units: W m-2 nm-1
    _FillValue: -9999.0
unlimited dimensions: time
current shape = (1440, 23)
filling off

<class 'netCDF4.Variable'>
uint8 model_case_flag(time)
    long_name: EUV spectrum product quality case number.
    valid_min: 1
    valid_max: 8
    flag_values: [1 2 3 4 5 6 7 8]
    flag_meanings: XRS_and_EUVS-A_and_EUVS-B_and_EUVS-C_and_no_geocorona XRS_and_EUVS-A_and_EUVS-B_and_EUVS-C_and_geocorona XRS_and_no_EUVS-A_and_no_EUVS-B_and_EUVS-C_and_no_geocorona XRS_and_EUVS-A_and_EUVS-B_and_no_EUVS-C_and_no_geocorona XRS_and_no_EUVS-A_and_EUVS-B_and_EUVS-C_and_no_geocorona XRS_and_EUVS-A_and_no_EUVS-B_and_EUVS-C_and_no_geocorona no_XRS_and_EUVS-A_and_EUVS-B_and_EUVS-C_and_no_geocorona no_spectrum_due_to_missing_data
unlimited dimensions: time
current shape = (1440,)
filling off
Because the model spectrum depends on all the different XRS irradiance measurements, there are flags for every case of one or more of the irradiance measurements (EUVS-A, B, etc.) being excluded from the model spectrum. The first model spectrum flag, ‘XRS_and_EUVS-A_and_EUVS-B_and_EUVS-C_and_no_geocorona’, indicates that all the irradiance measurements are included and there is no geocoronal absorption. Only irradiance that is marked with this flag should be used for analysis.
euvspec_flag = ncflag.FlagWrap.init_from_netcdf(euvs_data["model_case_flag"])
euvspec_good_flag = euvspec_flag.get_flag('XRS_and_EUVS-A_and_EUVS-B_and_EUVS-C_and_no_geocorona')
euvspec_good_flag_set = np.count_nonzero(euvspec_good_flag)
print('Number of indices at which all inputs are available for the EUVSPEC irradiance:')
print(f"{'XRS_and_EUVS-A_and_EUVS-B_and_EUVS-C_and_no_geocorona':<53}: {euvspec_good_flag_set}")
Number of indices at which all inputs are available for the EUVSPEC irradiance:
XRS_and_EUVS-A_and_EUVS-B_and_EUVS-C_and_no_geocorona: 1073
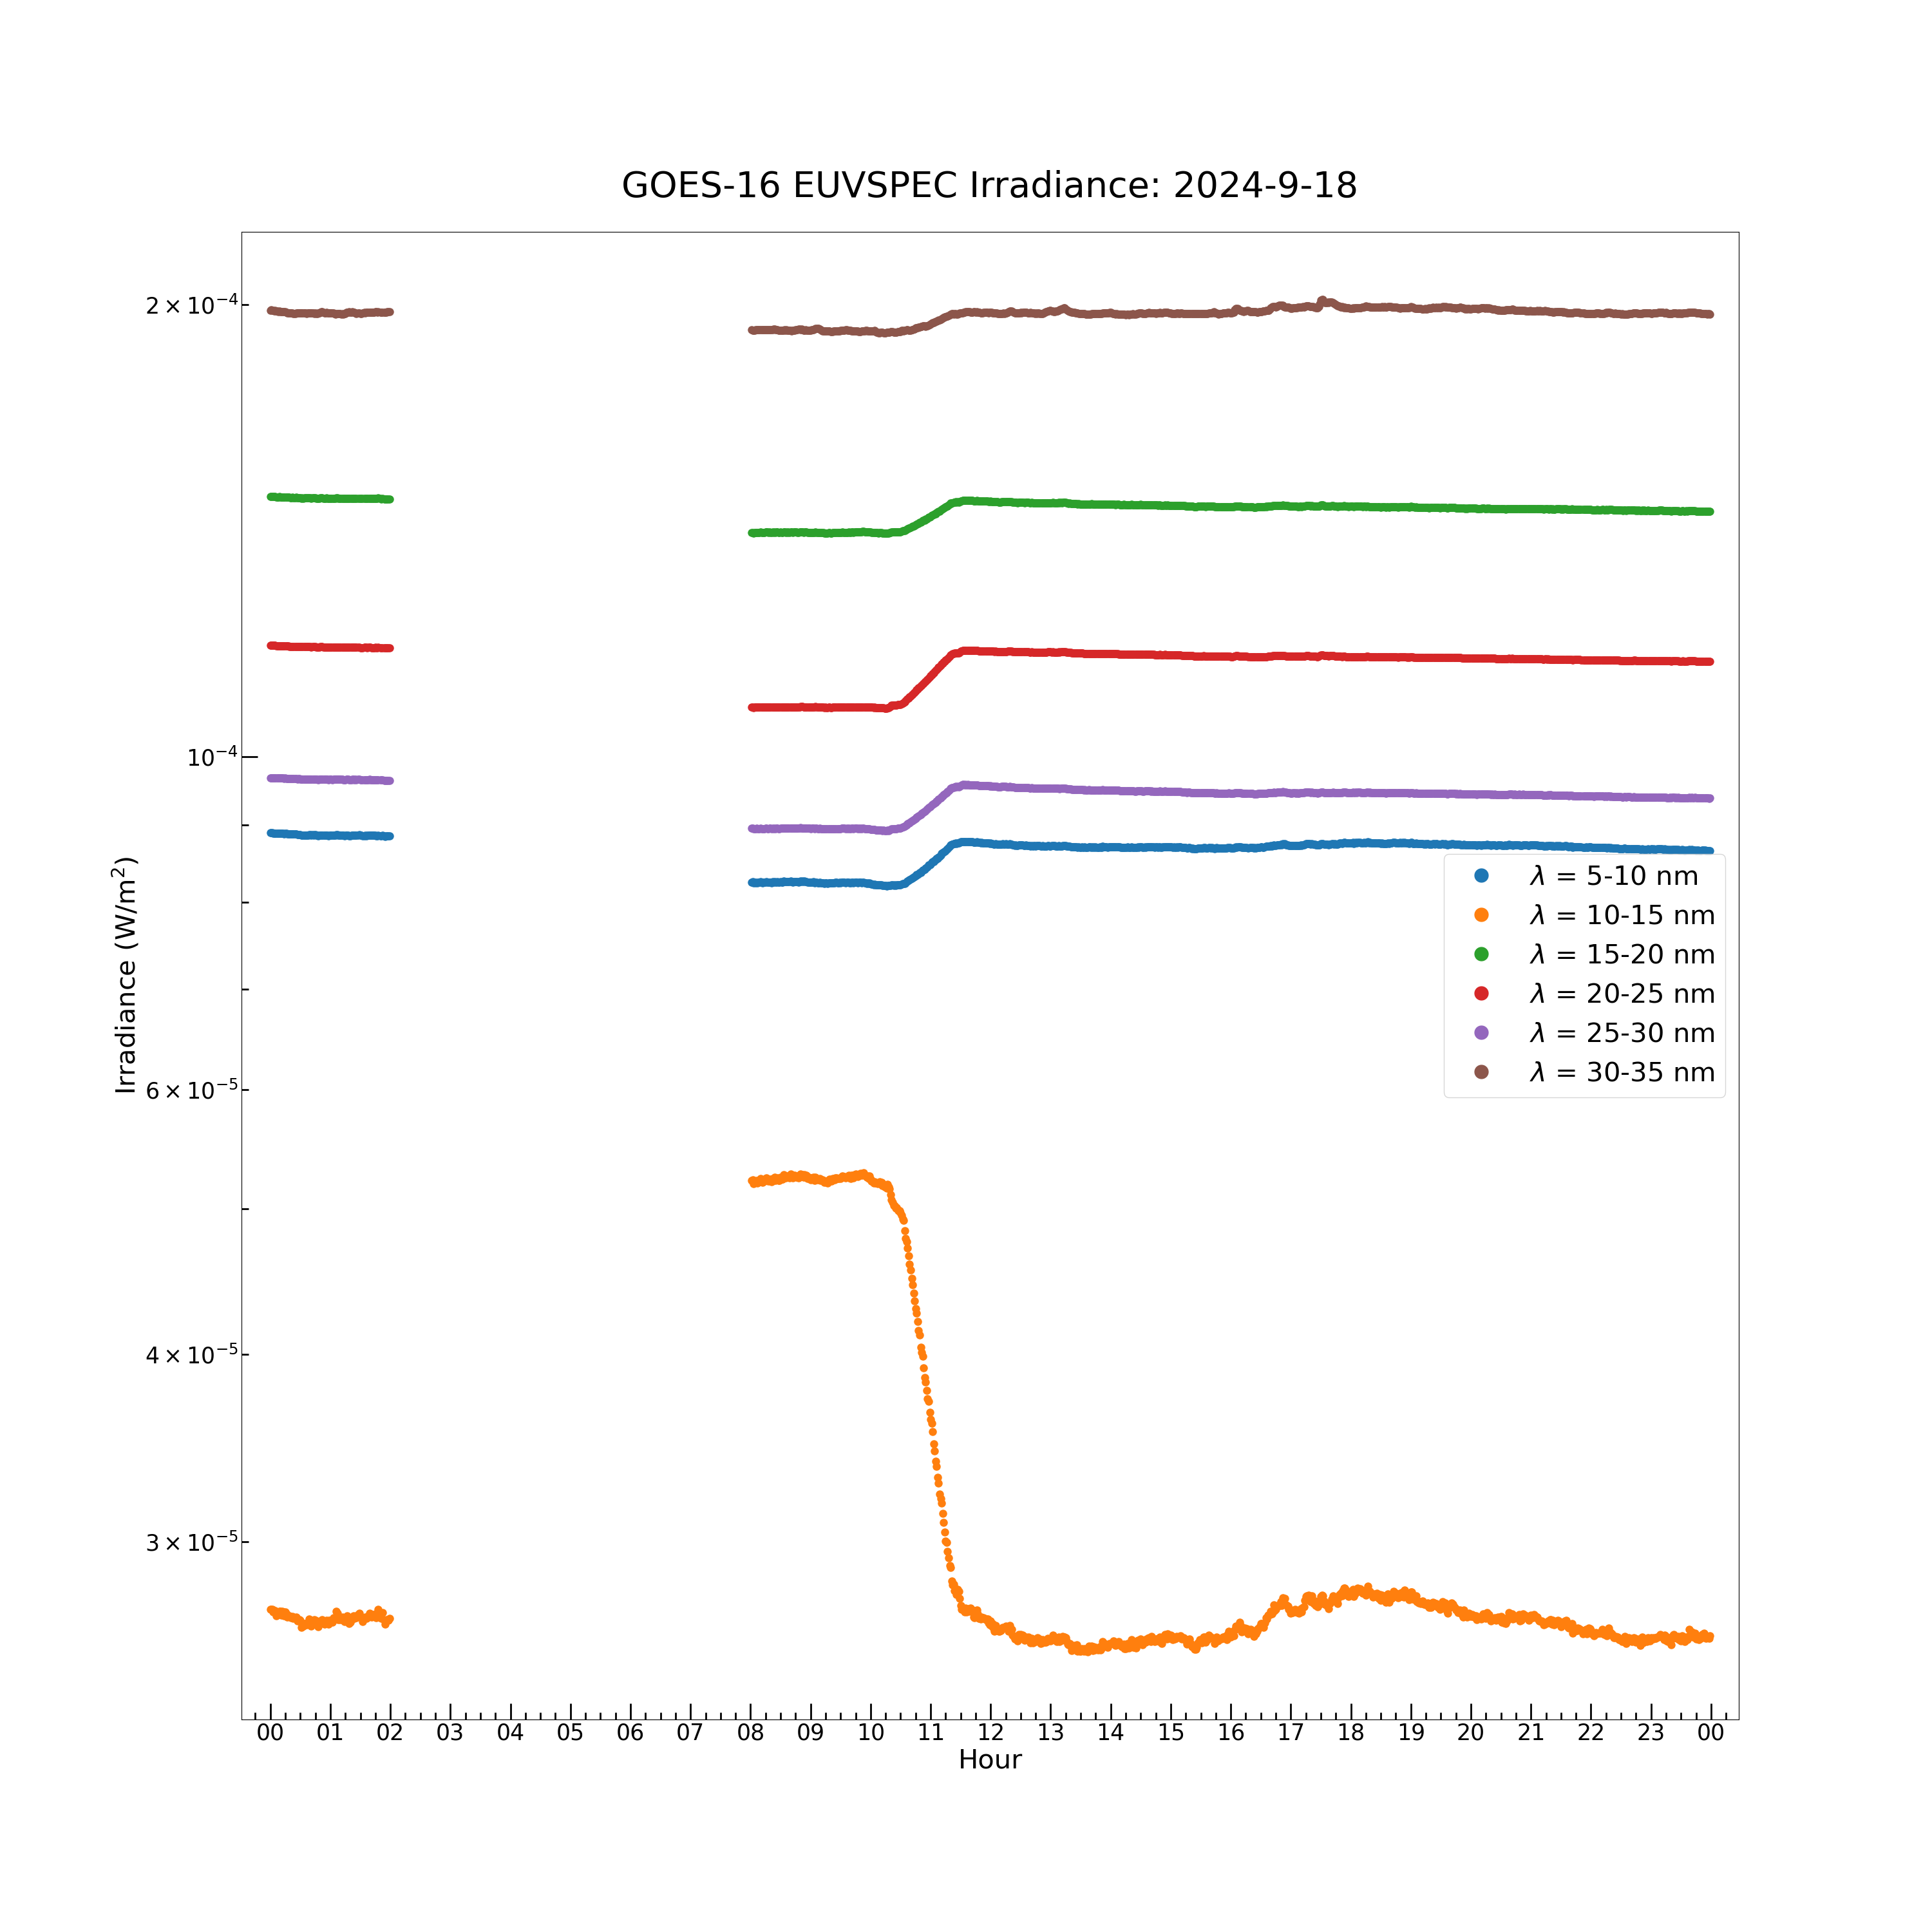
The model spectrum contains 23 wavelength bands: 5-10 nm, 10-15 nm, 15-20 nm, 20-25 nm, 25-30 nm, 30-35 nm, 35-40 nm, 40-45 nm, 45-50 nm, 50-55 nm, 55-60 nm, 60-65 nm, 65-70 nm, 70-75 nm, 75-80 nm, 80-85 nm, 85-90 nm, 90-95 nm, 95-100 nm, 100-105 nm, 105-110 nm, 110-115 nm and 117-127 nm. The model spectrum irradiance data array is a [1440, 23] element 2D array. Each of the 23 wavelength bands has an irradiance value at each of the 1440 timestamps in the day of data.
There are 2 ways to plot the model spectrum data: irradiance vs. time for each of the 23 wavelength bins, and irradiance vs. wavelength bin at a single timestamp.
euvspec_irrad = np.ma.filled(euvs_data["model_irradiance_spectrum"][:], np.nan)
# Define arrays of the EUVSPEC values and replace the missing and fill values in the irradiance with NaN values. The missing and fill values in the NetCDF data array are masked indices. The np.ma.filled() code is a simple way to replace the masked values with NaNs, which excludes them from plotting and numerical operations.
plt.figure(figsize = (30, 30))
plt.plot(euvs_timestamps[euvspec_good_flag], euvspec_irrad[euvspec_good_flag, 0], color = 'C0', label = r'$\lambda$ = 5-10 nm', marker = \
'.', markersize = 16, linestyle = 'none')
plt.plot(euvs_timestamps[euvspec_good_flag], euvspec_irrad[euvspec_good_flag, 1], color = 'C1', label = r'$\lambda$ = 10-15 nm', marker = \
'.', markersize = 16, linestyle = 'none')
plt.plot(euvs_timestamps[euvspec_good_flag], euvspec_irrad[euvspec_good_flag, 2], color = 'C2', label = r'$\lambda$ = 15-20 nm', marker = \
'.', markersize = 16, linestyle = 'none')
plt.plot(euvs_timestamps[euvspec_good_flag], euvspec_irrad[euvspec_good_flag, 3], color = 'C3', label = r'$\lambda$ = 20-25 nm', marker = \
'.', markersize = 16, linestyle = 'none')
plt.plot(euvs_timestamps[euvspec_good_flag], euvspec_irrad[euvspec_good_flag, 4], color = 'C4', label = r'$\lambda$ = 25-30 nm', marker = \
'.', markersize = 16, linestyle = 'none')
plt.plot(euvs_timestamps[euvspec_good_flag], euvspec_irrad[euvspec_good_flag, 5], color = 'C5', label = r'$\lambda$ = 30-35 nm', marker = \
'.', markersize = 16, linestyle = 'none')
plt.rc('font', size = 25)
plt.yscale('log')
plt.xlabel('Hour', fontsize = 30)
plt.ylabel('Irradiance (W/m$^2$)', fontsize = 30)
plt.gca().xaxis.set_major_locator(mdates.HourLocator())
plt.gca().xaxis.set_major_formatter(mdates.DateFormatter('%H'))
plt.gca().xaxis.set_minor_locator(mdates.MinuteLocator([15, 30, 45]))
plt.tick_params(axis = 'x', which = 'major', length = 18, width = 2, direction = 'in')
plt.tick_params(axis = 'x', which = 'minor', length = 8, width = 2, direction = 'in')
plt.tick_params(axis = 'y', which = 'major', length = 18, width = 2, direction = 'in')
plt.tick_params(axis = 'y', which = 'minor', length = 8, width = 2, direction = 'in')
plt.xticks(fontsize = 25, ha = 'center')
plt.yticks(fontsize = 25)
lg = plt.legend(loc = 'best', fontsize = 30, numpoints = 1)
lg.legend_handles[0].set_markersize(30)
lg.legend_handles[1].set_markersize(30)
lg.legend_handles[2].set_markersize(30)
lg.legend_handles[3].set_markersize(30)
lg.legend_handles[4].set_markersize(30)
lg.legend_handles[5].set_markersize(30)
plt.margins(0.02, 0.05)
plt.title('GOES-16 EUVSPEC Irradiance: ' + euvs_timestamps[0].strftime("%Y-%m-%d"), fontsize = 40, y = 1.02)
# Plot EUVSPEC data.
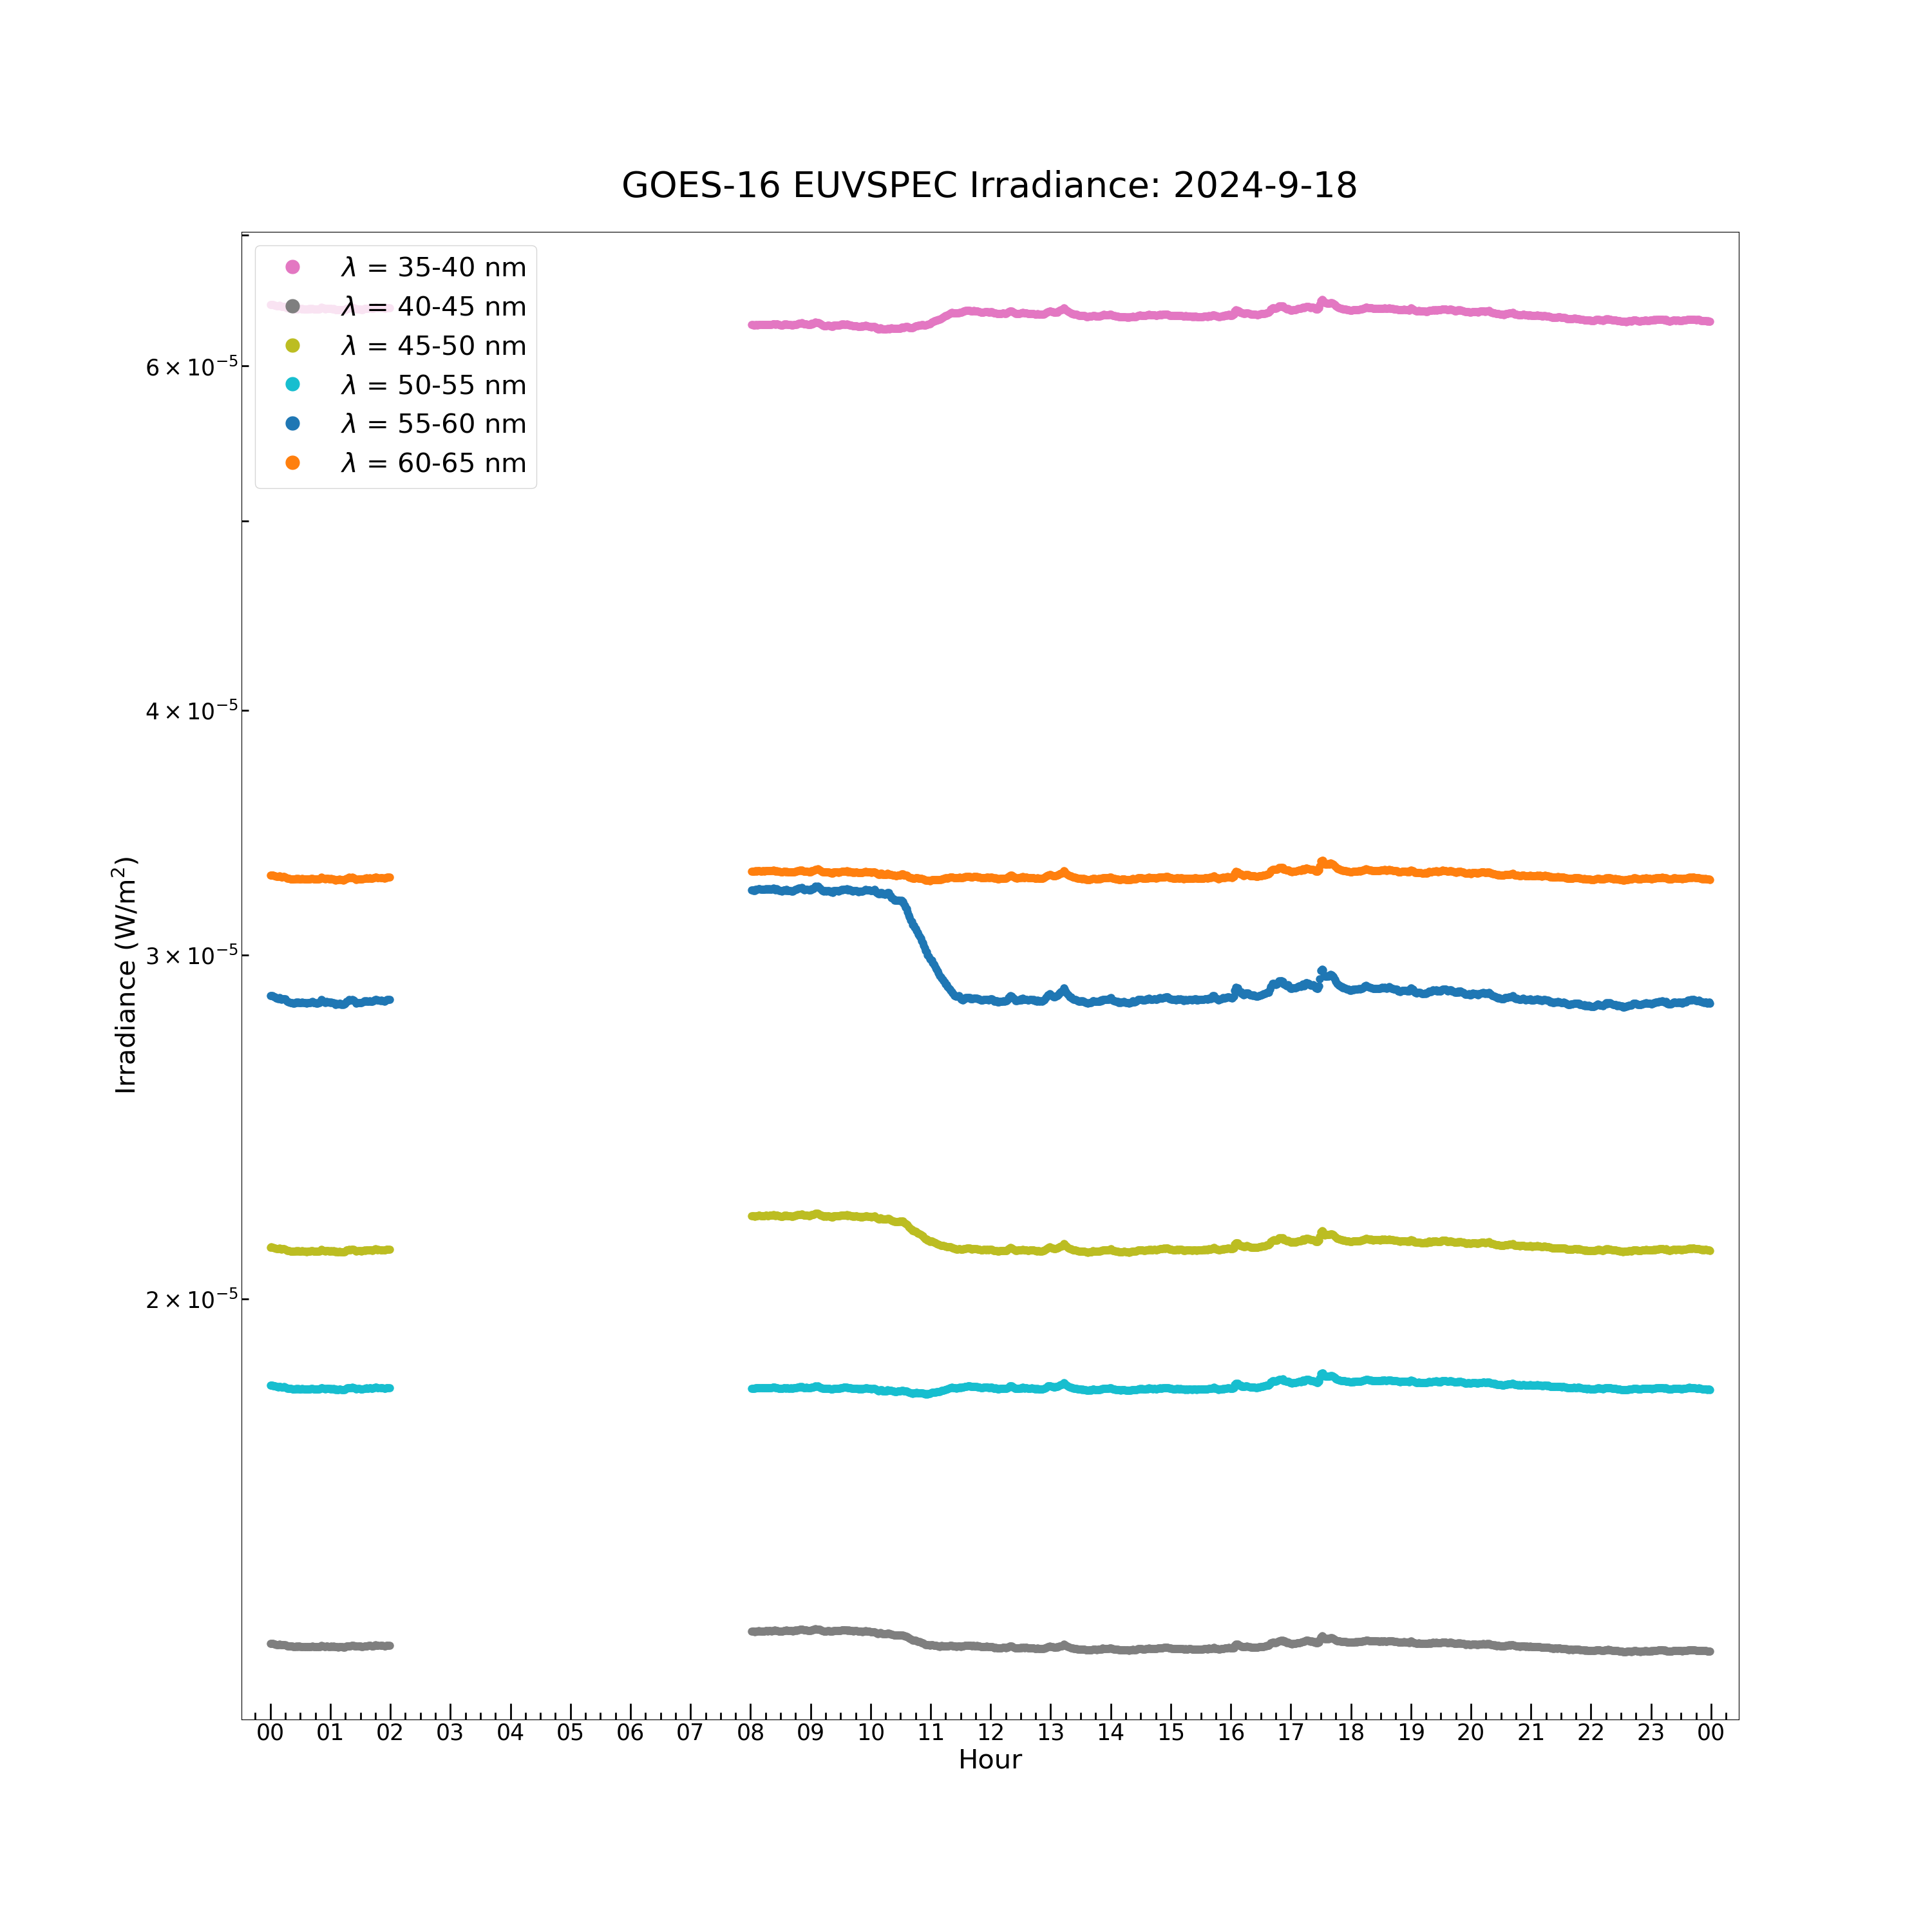
plt.figure(figsize = (30, 30))
plt.plot(euvs_timestamps[euvspec_good_flag], euvspec_irrad[euvspec_good_flag, 6], color = 'C6', label = r'$\lambda$ = 35-40 nm', marker = \
'.', markersize = 16, linestyle = 'none')
plt.plot(euvs_timestamps[euvspec_good_flag], euvspec_irrad[euvspec_good_flag, 7], color = 'C7', label = r'$\lambda$ = 40-45 nm', marker = \
'.', markersize = 16, linestyle = 'none')
plt.plot(euvs_timestamps[euvspec_good_flag], euvspec_irrad[euvspec_good_flag, 8], color = 'C8', label = r'$\lambda$ = 45-50 nm', marker = \
'.', markersize = 16, linestyle = 'none')
plt.plot(euvs_timestamps[euvspec_good_flag], euvspec_irrad[euvspec_good_flag, 9], color = 'C9', label = r'$\lambda$ = 50-55 nm', marker = \
'.', markersize = 16, linestyle = 'none')
plt.plot(euvs_timestamps[euvspec_good_flag], euvspec_irrad[euvspec_good_flag, 10], color = 'C10', label = r'$\lambda$ = 55-60 nm', marker \
= '.', markersize = 16, linestyle = 'none')
plt.plot(euvs_timestamps[euvspec_good_flag], euvspec_irrad[euvspec_good_flag, 11], color = 'C11', label = r'$\lambda$ = 60-65 nm', marker \
= '.', markersize = 16, linestyle = 'none')
plt.rc('font', size = 25)
plt.yscale('log')
plt.xlabel('Hour', fontsize = 30)
plt.ylabel('Irradiance (W/m$^2$)', fontsize = 30)
plt.gca().xaxis.set_major_locator(mdates.HourLocator())
plt.gca().xaxis.set_major_formatter(mdates.DateFormatter('%H'))
plt.gca().xaxis.set_minor_locator(mdates.MinuteLocator([15, 30, 45]))
plt.tick_params(axis = 'x', which = 'major', length = 18, width = 2, direction = 'in')
plt.tick_params(axis = 'x', which = 'minor', length = 8, width = 2, direction = 'in')
plt.tick_params(axis = 'y', which = 'major', length = 18, width = 2, direction = 'in')
plt.tick_params(axis = 'y', which = 'minor', length = 8, width = 2, direction = 'in')
plt.xticks(fontsize = 25, ha = 'center')
plt.yticks(fontsize = 25)
lg = plt.legend(loc = 'best', fontsize = 30, numpoints = 1)
lg.legend_handles[0].set_markersize(30)
lg.legend_handles[1].set_markersize(30)
lg.legend_handles[2].set_markersize(30)
lg.legend_handles[3].set_markersize(30)
lg.legend_handles[4].set_markersize(30)
lg.legend_handles[5].set_markersize(30)
plt.margins(0.02, 0.05)
plt.title('GOES-16 EUVSPEC Irradiance: ' + euvs_timestamps[0].strftime("%Y-%m-%d"), fontsize = 40, y = 1.02)
# Plot EUVSPEC data.
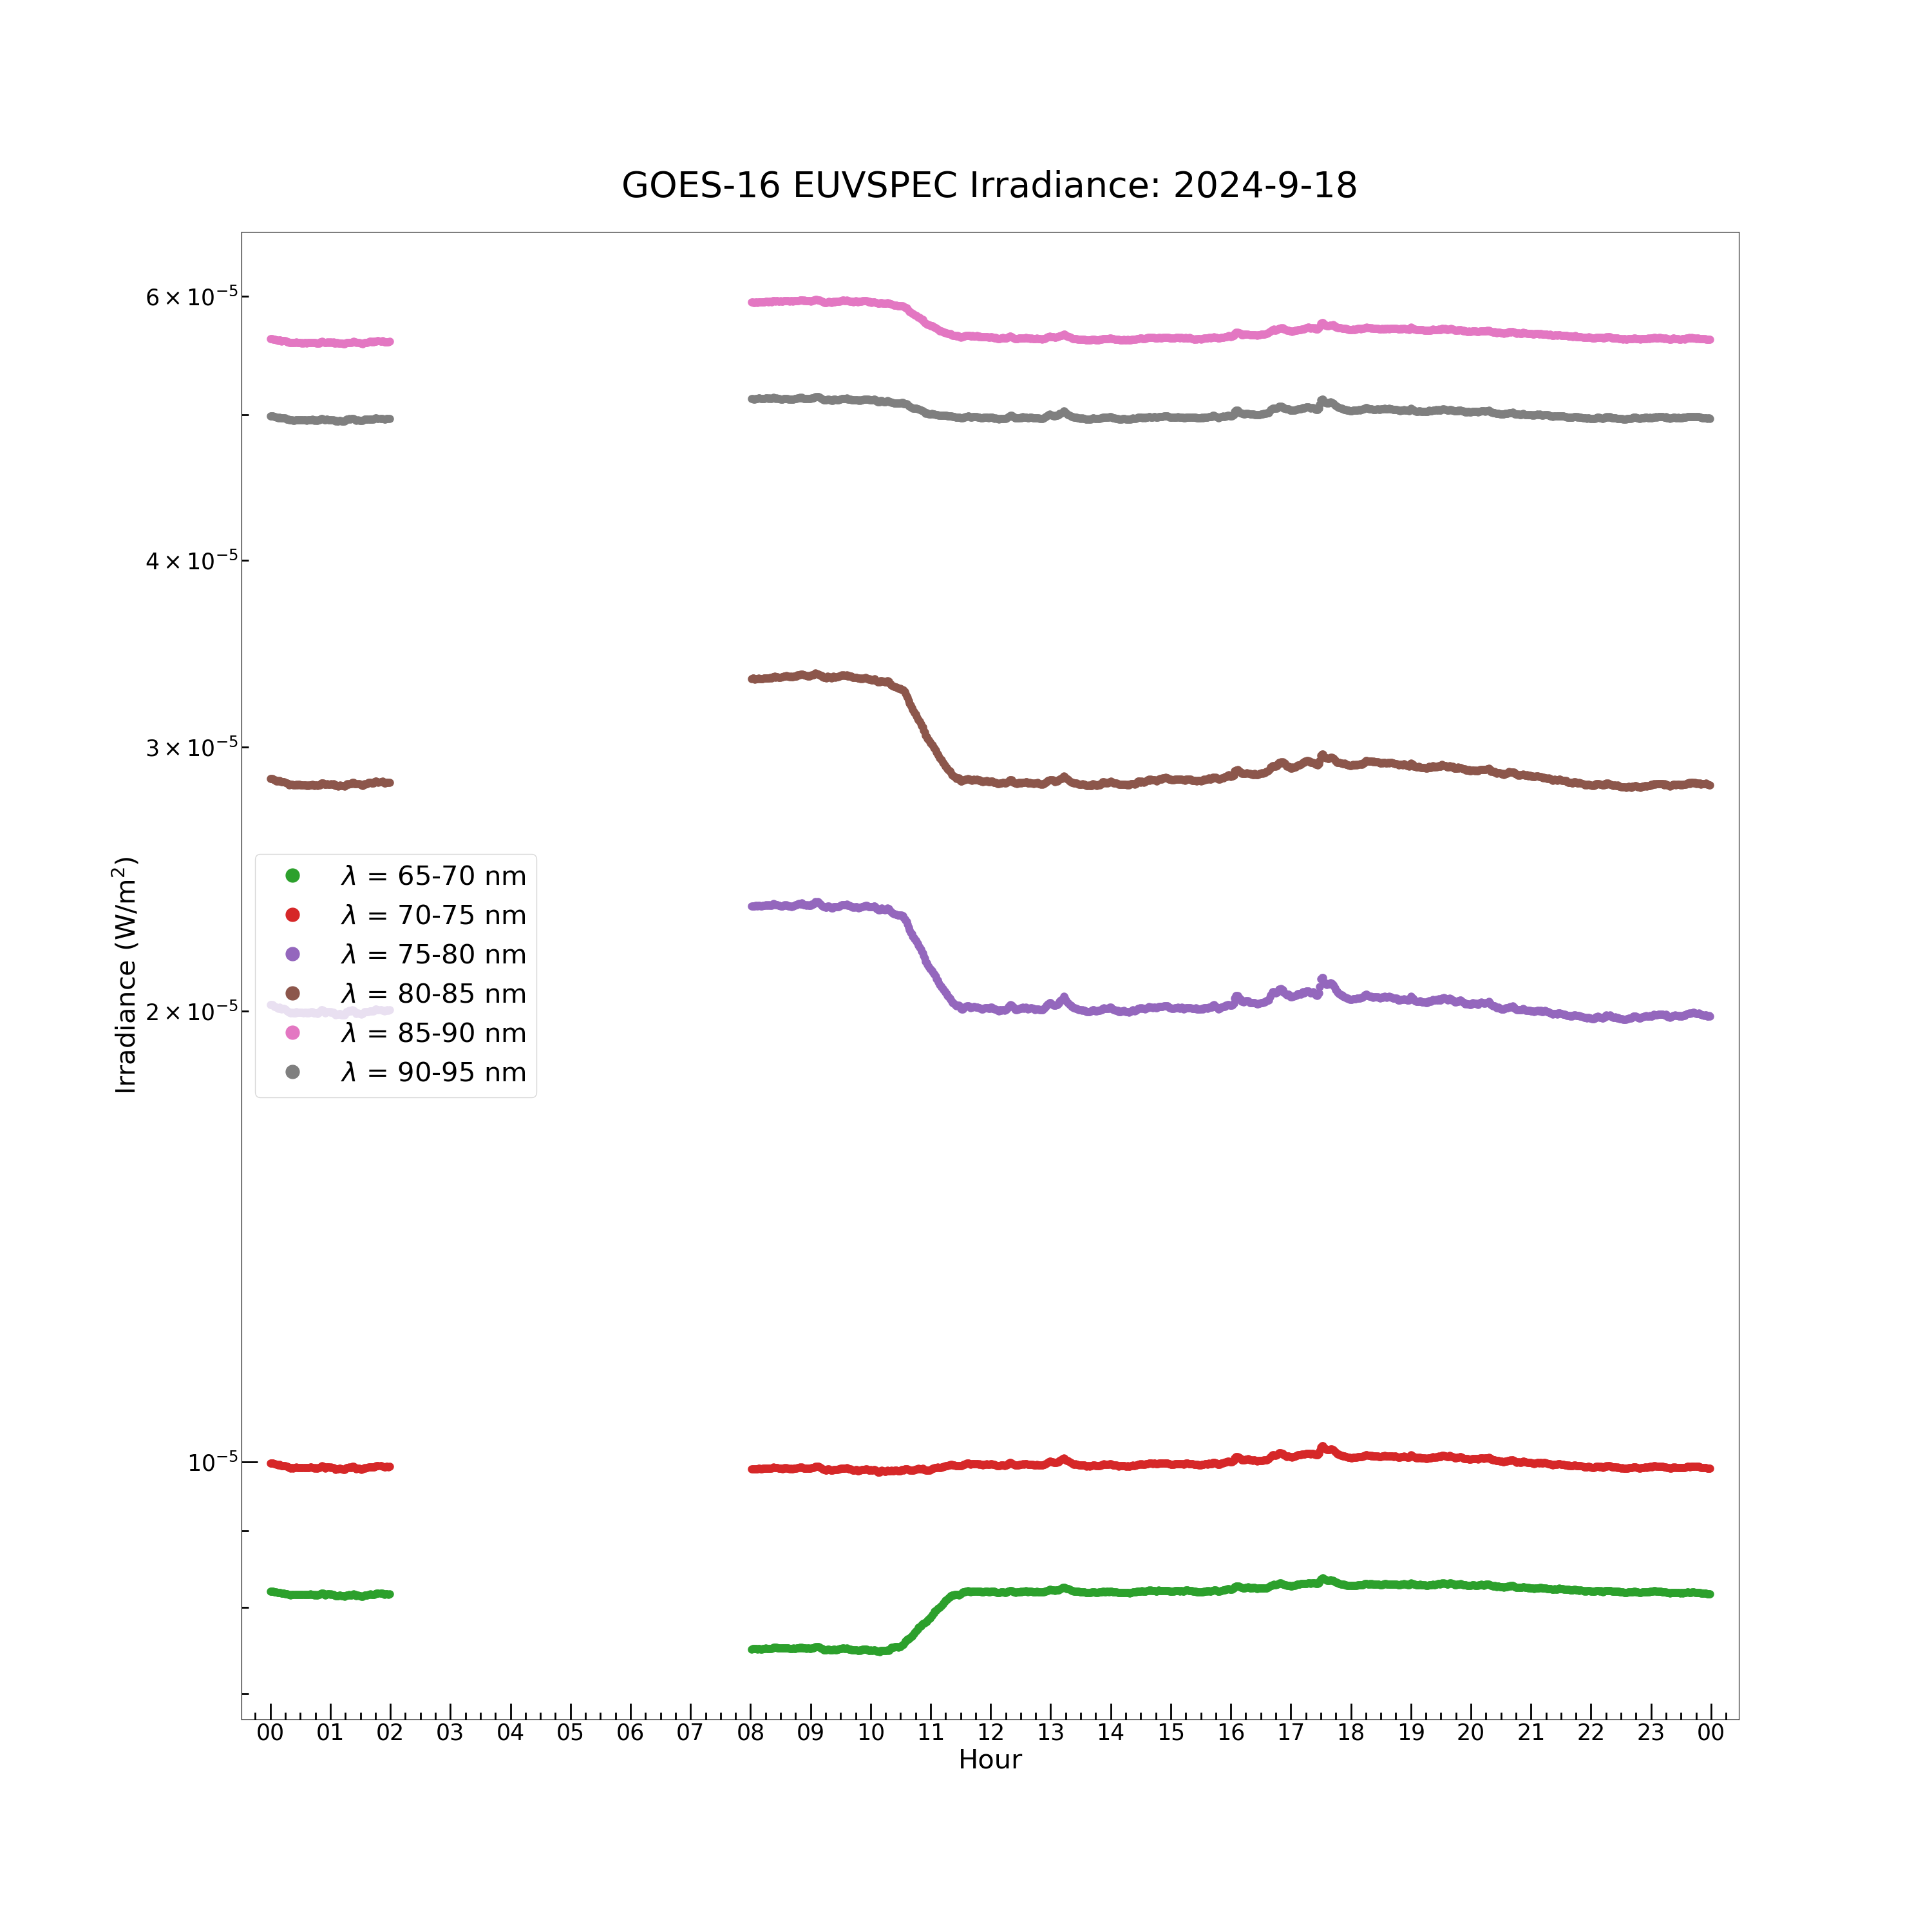
plt.figure(figsize = (30, 30))
plt.plot(euvs_timestamps[euvspec_good_flag], euvspec_irrad[euvspec_good_flag, 12], color = 'C12', label = r'$\lambda$ = 65-70 nm', marker \
= '.', markersize = 16, linestyle = 'none')
plt.plot(euvs_timestamps[euvspec_good_flag], euvspec_irrad[euvspec_good_flag, 13], color = 'C13', label = r'$\lambda$ = 70-75 nm', marker \
= '.', markersize = 16, linestyle = 'none')
plt.plot(euvs_timestamps[euvspec_good_flag], euvspec_irrad[euvspec_good_flag, 14], color = 'C14', label = r'$\lambda$ = 75-80 nm', marker \
= '.', markersize = 16, linestyle = 'none')
plt.plot(euvs_timestamps[euvspec_good_flag], euvspec_irrad[euvspec_good_flag, 15], color = 'C15', label = r'$\lambda$ = 80-85 nm', marker \
= '.', markersize = 16, linestyle = 'none')
plt.plot(euvs_timestamps[euvspec_good_flag], euvspec_irrad[euvspec_good_flag, 16], color = 'C16', label = r'$\lambda$ = 85-90 nm', marker \
= '.', markersize = 16, linestyle = 'none')
plt.plot(euvs_timestamps[euvspec_good_flag], euvspec_irrad[euvspec_good_flag, 17], color = 'C17', label = r'$\lambda$ = 90-95 nm', marker \
= '.', markersize = 16, linestyle = 'none')
plt.rc('font', size = 25)
plt.yscale('log')
plt.xlabel('Hour', fontsize = 30)
plt.ylabel('Irradiance (W/m$^2$)', fontsize = 30)
plt.gca().xaxis.set_major_locator(mdates.HourLocator())
plt.gca().xaxis.set_major_formatter(mdates.DateFormatter('%H'))
plt.gca().xaxis.set_minor_locator(mdates.MinuteLocator([15, 30, 45]))
plt.tick_params(axis = 'x', which = 'major', length = 18, width = 2, direction = 'in')
plt.tick_params(axis = 'x', which = 'minor', length = 8, width = 2, direction = 'in')
plt.tick_params(axis = 'y', which = 'major', length = 18, width = 2, direction = 'in')
plt.tick_params(axis = 'y', which = 'minor', length = 8, width = 2, direction = 'in')
plt.xticks(fontsize = 25, ha = 'center')
plt.yticks(fontsize = 25)
lg = plt.legend(loc = 'best', fontsize = 30, numpoints = 1)
lg.legend_handles[0].set_markersize(30)
lg.legend_handles[1].set_markersize(30)
lg.legend_handles[2].set_markersize(30)
lg.legend_handles[3].set_markersize(30)
lg.legend_handles[4].set_markersize(30)
lg.legend_handles[5].set_markersize(30)
plt.margins(0.02, 0.05)
plt.title('GOES-16 EUVSPEC Irradiance: ' + euvs_timestamps[0].strftime("%Y-%m-%d"), fontsize = 40, y = 1.02)
# Plot EUVSPEC data.
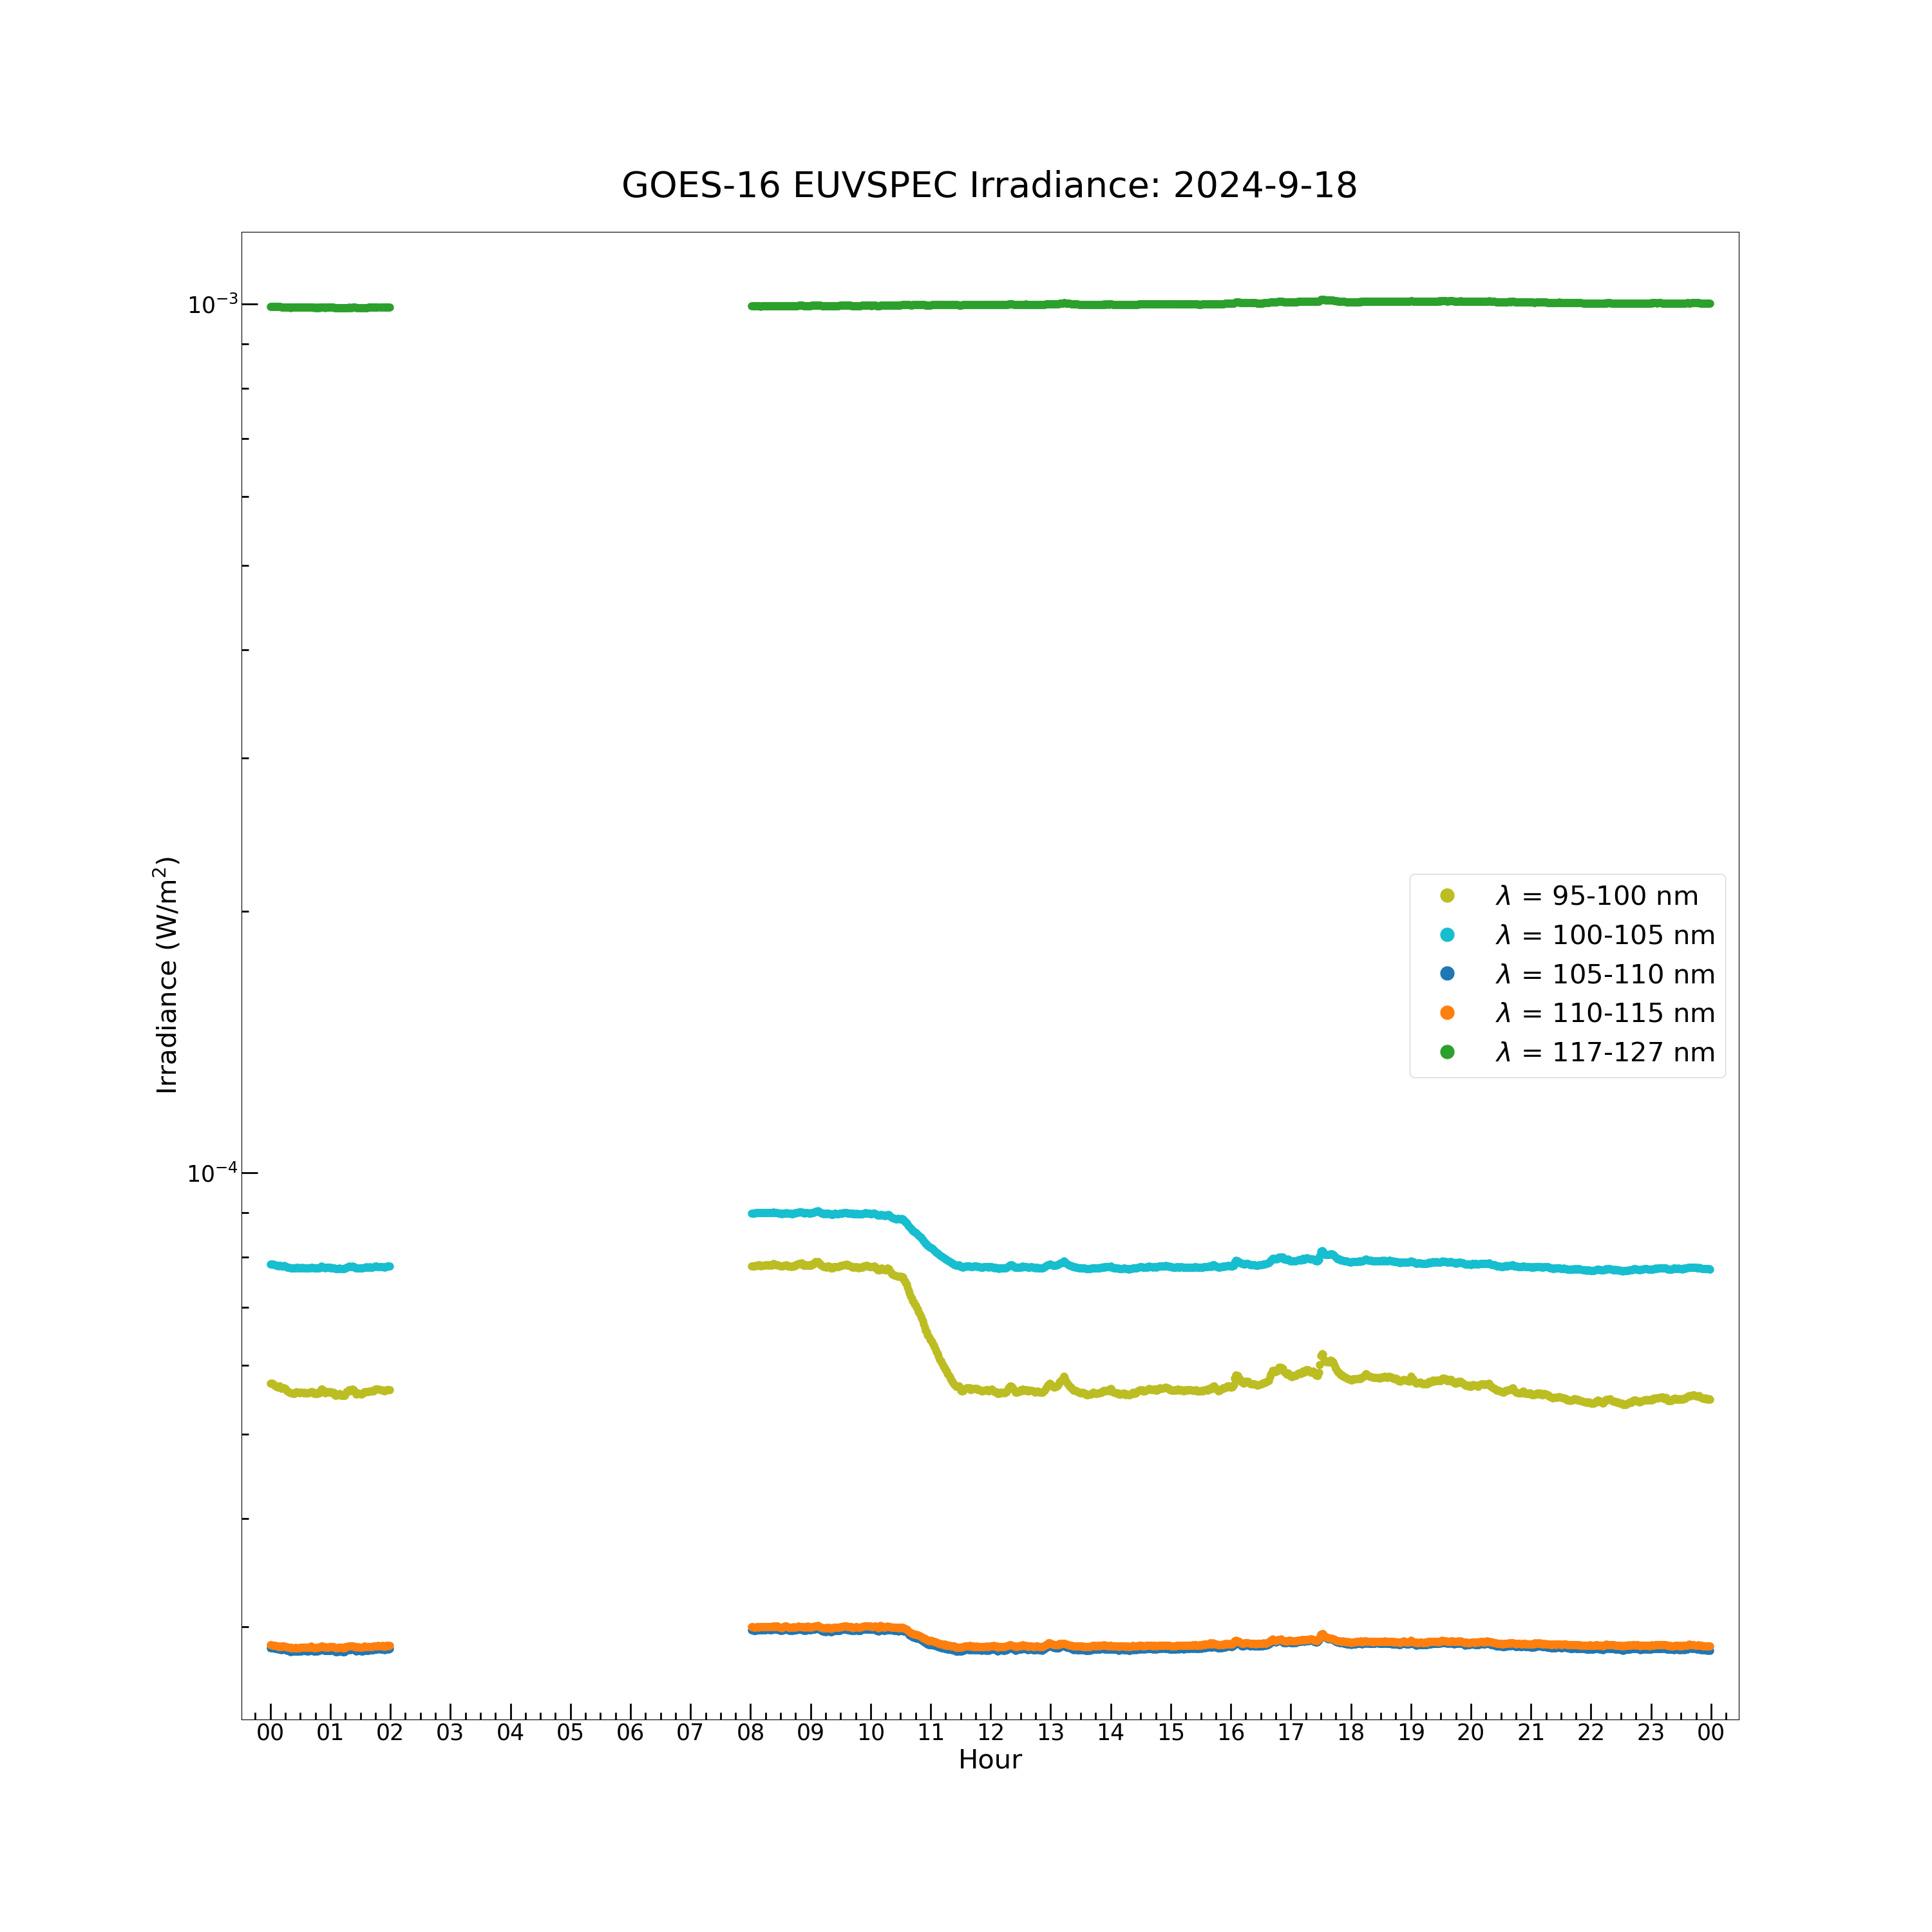
plt.figure(figsize = (30, 30))
plt.plot(euvs_timestamps[euvspec_good_flag], euvspec_irrad[euvspec_good_flag, 18], color = 'C18', label = r'$\lambda$ = 95-100 nm', marker \
= '.', markersize = 16, linestyle = 'none')
plt.plot(euvs_timestamps[euvspec_good_flag], euvspec_irrad[euvspec_good_flag, 19], color = 'C19', label = r'$\lambda$ = 100-105 nm', \
marker = '.', markersize = 16, linestyle = 'none')
plt.plot(euvs_timestamps[euvspec_good_flag], euvspec_irrad[euvspec_good_flag, 20], color = 'C20', label = r'$\lambda$ = 105-110 nm', \
marker = '.', markersize = 16, linestyle = 'none')
plt.plot(euvs_timestamps[euvspec_good_flag], euvspec_irrad[euvspec_good_flag, 21], color = 'C21', label = r'$\lambda$ = 110-115 nm', \
marker = '.', markersize = 16, linestyle = 'none')
plt.plot(euvs_timestamps[euvspec_good_flag], euvspec_irrad[euvspec_good_flag, 22], color = 'C22', label = r'$\lambda$ = 117-127 nm', \
marker = '.', markersize = 16, linestyle = 'none')
plt.rc('font', size = 25)
plt.yscale('log')
plt.xlabel('Hour', fontsize = 30)
plt.ylabel('Irradiance (W/m$^2$)', fontsize = 30)
plt.gca().xaxis.set_major_locator(mdates.HourLocator())
plt.gca().xaxis.set_major_formatter(mdates.DateFormatter('%H'))
plt.gca().xaxis.set_minor_locator(mdates.MinuteLocator([15, 30, 45]))
plt.tick_params(axis = 'x', which = 'major', length = 18, width = 2, direction = 'in')
plt.tick_params(axis = 'x', which = 'minor', length = 8, width = 2, direction = 'in')
plt.tick_params(axis = 'y', which = 'major', length = 18, width = 2, direction = 'in')
plt.tick_params(axis = 'y', which = 'minor', length = 8, width = 2, direction = 'in')
plt.xticks(fontsize = 25, ha = 'center')
plt.yticks(fontsize = 25)
lg = plt.legend(loc = 'best', fontsize = 30, numpoints = 1)
lg.legend_handles[0].set_markersize(30)
lg.legend_handles[1].set_markersize(30)
lg.legend_handles[2].set_markersize(30)
lg.legend_handles[3].set_markersize(30)
lg.legend_handles[4].set_markersize(30)
plt.margins(0.02, 0.05)
plt.title('GOES-16 EUVSPEC Irradiance: ' + euvs_timestamps[0].strftime("%Y-%m-%d"), fontsize = 40, y = 1.02)
# Plot EUVSPEC data.
Text(0.5, 1.02, 'GOES-16 EUVSPEC Irradiance: 2024-09-18')
Because the quality flag used for the model spectrum irradiance includes a condition of the geocorona, the model spectrum irradiance is flagged from 02:00-08:00, where the ‘degraded_due_to_geocorona’ flag is set.
plt.figure(figsize = (30, 30))
wavelength_bin = np.array([5, 10, 15, 20, 25, 30, 35, 40, 45, 50, 55, 60, 65, 70, 75, 80, 85, 90, 95, 100, 105, 110, 117, 127])
wavelength_label = np.array(['5', '10', '15', '20', '25', '30', '35', '40', '45', '50', '55', '60', '65', '70', '75', '80', '85', '90', \
                             '95', '100', '105', '110', '117', '127'])
plt.plot(euvs_data["model_wavelength_bounds"][:, 0] + 2.5, euvspec_irrad[0, :], color = 'black', marker = '.', markersize = 40, linestyle \
         = '-', label = euvs_timestamps[0].strftime("%H:%M"))
plt.plot(euvs_data["model_wavelength_bounds"][:, 0] + 2.5, euvspec_irrad[500, :], color = 'blue', marker = '.', markersize = 35, linestyle \
         = '-', label = euvs_timestamps[500].strftime("%H:%M"))
plt.plot(euvs_data["model_wavelength_bounds"][:, 0] + 2.5, euvspec_irrad[1000, :], color = 'red', marker = '.', markersize = 30, linestyle \
         = '-', label = euvs_timestamps[1000].strftime("%H:%M"))
plt.rc('font', size = 25)
plt.xlabel('Wavelength Bin (nm)', fontsize = 30)
plt.ylabel('Irradiance (W/m$^2$)', fontsize = 30)
plt.gca().yaxis.set_minor_locator(tck.AutoMinorLocator(4))
plt.tick_params(axis = 'x', which = 'major', length = 18, width = 2, direction = 'in')
plt.tick_params(axis = 'x', which = 'minor', length = 8, width = 2, direction = 'in')
plt.tick_params(axis = 'y', which = 'major', length = 18, width = 2, direction = 'in')
plt.tick_params(axis = 'y', which = 'minor', length = 8, width = 2, direction = 'in')
plt.xticks(wavelength_bin, wavelength_label, fontsize = 25, ha = 'center')
plt.yticks(fontsize = 25)
plt.margins(0.02, 0.05)
plt.xlim([0, 130])
lg = plt.legend(loc = 'best', fontsize = 30, numpoints = 1)
lg.legend_handles[0].set_markersize(30)
lg.legend_handles[1].set_markersize(30)
lg.legend_handles[2].set_markersize(30)
plt.title('GOES-16 EUVSPEC Irradiance: ' + euvs_timestamps[0].strftime("%Y-%m-%d"), fontsize = 40, y = 1.02)
# Plot EUVSPEC data.
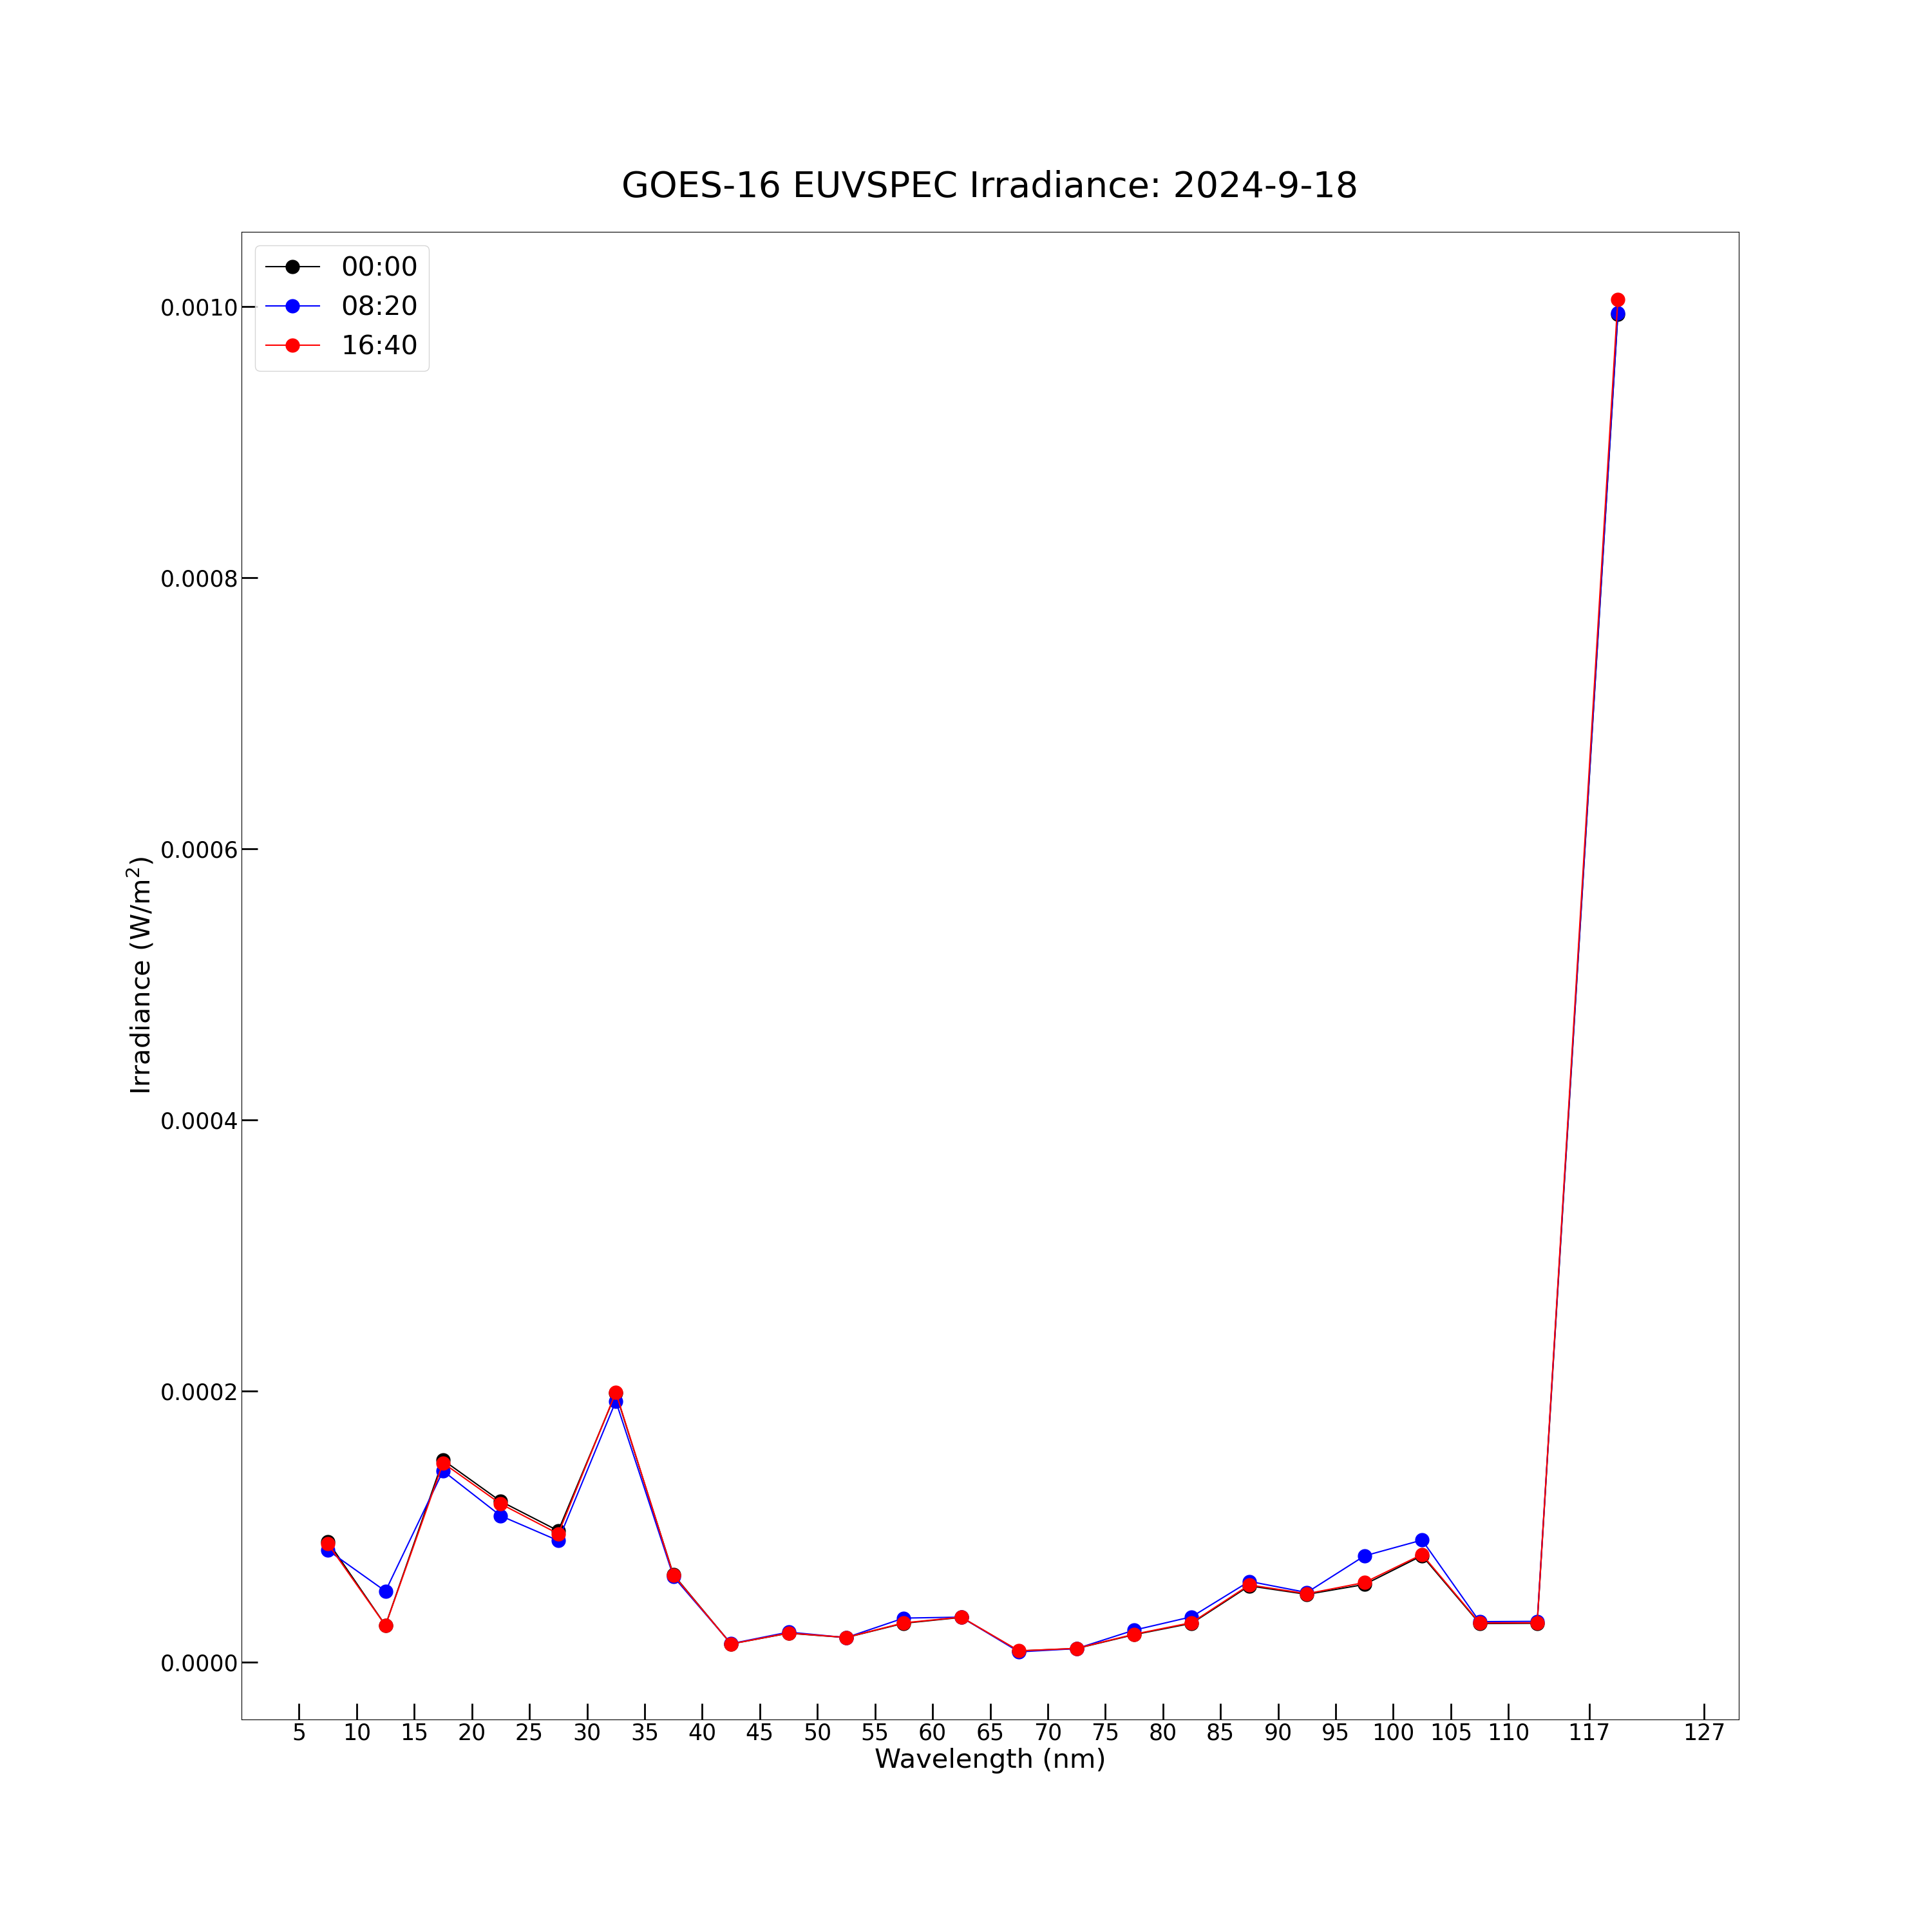
Text(0.5, 1.02, 'GOES-16 EUVSPEC Irradiance: 2024-09-18')
This plot shows the model spectrum irradiance at each wavelength bin at 3 different times. These indices are chosen to avoid the time range where the EUVS-B irradiance is removed due to the geocorona. The irradiance for each wavelength bin is plotted in the middle of that bin.
euvs_data.close()
# Close the open NetCDF file.
Total running time of the script: (0 minutes 4.520 seconds)