Note
Go to the end to download the full example code.
Reading and plotting XRS data
- Purpose:
Python example of netcdf and plot commands for use with GOES-R EXIS files
__author__ = "jmachol"

import netCDF4 as nc
import numpy as np
import cftime
import matplotlib.pyplot as plt
from datetime import datetime
import os
import requests
import glob
from bs4 import BeautifulSoup

num_vars = 2
make_plot = 1
Relevant data files can be downloaded here.
Other data links and information about EXIS data can be found here
local_directory = './'
xrs_data_website = 'https://data.ngdc.noaa.gov/platforms/solar-space-observing-satellites/goes/goes16/l2/data/xrsf-l2-avg1m_science/2020/06/'
xrs_filename_prefix = 'sci_xrsf-l2-avg1m_g16_d20200601_v'
local_file = glob.glob(local_directory + xrs_filename_prefix + '*.nc')
if local_file:
    print(os.path.basename(local_file[0]) + ' data file exists in local working directory')
    xrs_filename = os.path.basename(local_file[0])
else:
    print('A data file matching ' + xrs_filename_prefix + \
          '*nc does not exist in working directory; downloading file from the GOES 16-19 data website')
    url = requests.get(xrs_data_website)
    if url.status_code == 200:
        url_files = BeautifulSoup(url.text, 'html.parser')
        for link in url_files.find_all('a'):
            xrs_file = link.get('href')
            if xrs_file and xrs_file.startswith(xrs_filename_prefix) and xrs_file.endswith('.nc'):
                with open(local_directory + xrs_file, "wb") as f:
                    r = requests.get(xrs_data_website + xrs_file)
                    f.write(r.content)
                    xrs_filename = xrs_file
# Check if the XRS data file exists in the local working directory. If the file does not exist in the local working directory, it will be downloaded to the local working directory from the GOES 16-19 space weather data website.
sci_xrsf-l2-avg1m_g16_d20200601_v2-2-1.nc data file exists in local working directory
Open netcdf file for reading data
ff = nc.Dataset(local_directory + xrs_filename)
Time conversion
datetime0 = cftime.num2pydate(ff.variables["time"][:], ff["time"].units)
print("Filename:  ", xrs_filename)
print("start time in file [{}]: {}".format(ff["time"].units, ff.variables["time"][0]))
print("start and end times:", datetime0[0], datetime0[-1])
Filename:   sci_xrsf-l2-avg1m_g16_d20200601_v2-2-1.nc
start time in file [seconds since 2000-01-01 12:00:00 UTC]: 644241600.0
start and end times: 2020-06-01 00:00:00 2020-06-01 23:59:00
Print some variable names and values
for ii in np.arange(num_vars):
    var = list(ff.variables.keys())[ii]
    val = ff.variables[var][:]
    print("{}[0]: {:8g}".format(var, val[0]))
xrsa_flux[0]: 3.16904e-09
xrsa_flux_observed[0]: 6.10827e-09
Print a global attribute
platform = getattr(ff, "platform")
print("satellite: ", platform)
satellite: g16
Print all variable names
print("\nAll variable names")
print(list(ff.variables.keys()), "\n")
All variable names
['xrsa_flux', 'xrsa_flux_observed', 'xrsa_flux_electrons', 'xrsb_flux', 'xrsb_flux_observed', 'xrsb_flux_electrons', 'xrsa_flag', 'xrsb_flag', 'xrsa_num', 'xrsb_num', 'time', 'xrsa_flag_excluded', 'xrsb_flag_excluded', 'au_factor', 'corrected_current_xrsb2', 'roll_angle', 'xrsa1_flux', 'xrsa1_flux_observed', 'xrsa1_flux_electrons', 'xrsa2_flux', 'xrsa2_flux_observed', 'xrsa2_flux_electrons', 'xrsb1_flux', 'xrsb1_flux_observed', 'xrsb1_flux_electrons', 'xrsb2_flux', 'xrsb2_flux_observed', 'xrsb2_flux_electrons', 'xrs_primary_chan', 'xrsa1_flag', 'xrsa2_flag', 'xrsb1_flag', 'xrsb2_flag', 'xrsa1_num', 'xrsa2_num', 'xrsb1_num', 'xrsb2_num', 'xrsa1_flag_excluded', 'xrsa2_flag_excluded', 'xrsb1_flag_excluded', 'xrsb2_flag_excluded', 'yaw_flip_flag', 'electron_correction_flag']
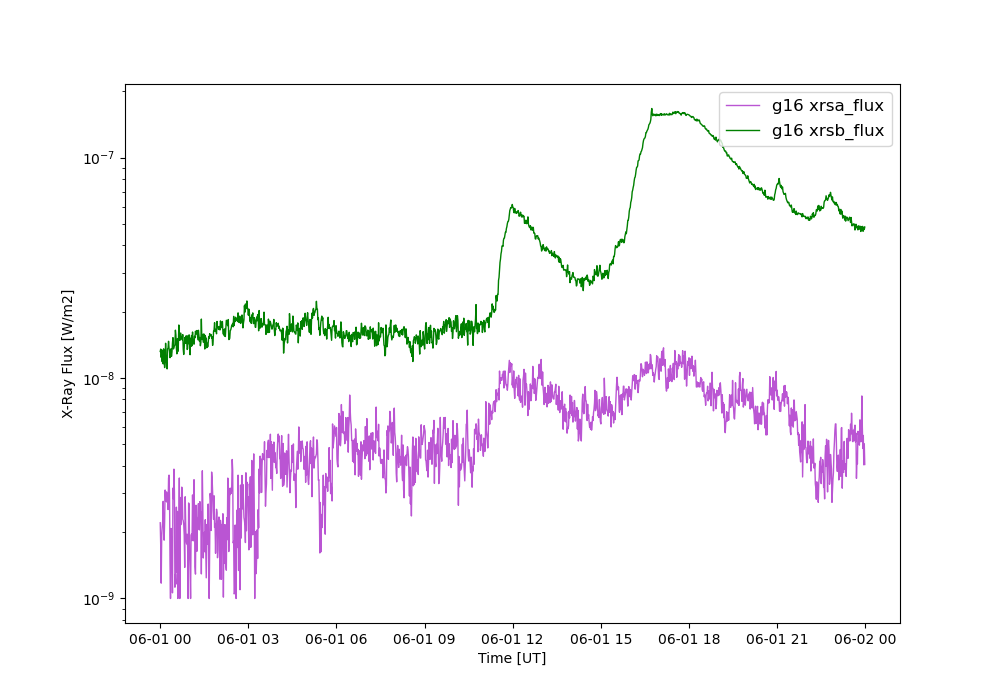
Plot 1 day of XRS data
var_name = ["xrsa_flux", "xrsb_flux"]
if make_plot:
    chan_color = ["mediumorchid", "green", "darkviolet", "indigo", "b",
                  "darkcyan", "greenyellow", "yellow", "gold", "orange",
                  "orangered", "darkred"][0:num_vars]
    plt.figure(0, figsize=[10, 7])
    for ii in range(num_vars):
        plt.plot(
            datetime0[:],
            ff.variables[var_name[ii]][:],
            linewidth=1,
            color=chan_color[ii],
            label="{} {}".format(platform, var_name[ii]),
        )
    plt.yscale("log")
    plt.legend(loc="upper right", prop={"size": 12})
    plt.xlabel("Time [UT]")
    plt.ylabel("X-Ray Flux [{}]".format(ff[var_name[0]].units))
    plt.show()
print("Done.\n")
Done.
Total running time of the script: (0 minutes 0.269 seconds)