Note
Go to the end to download the full example code.
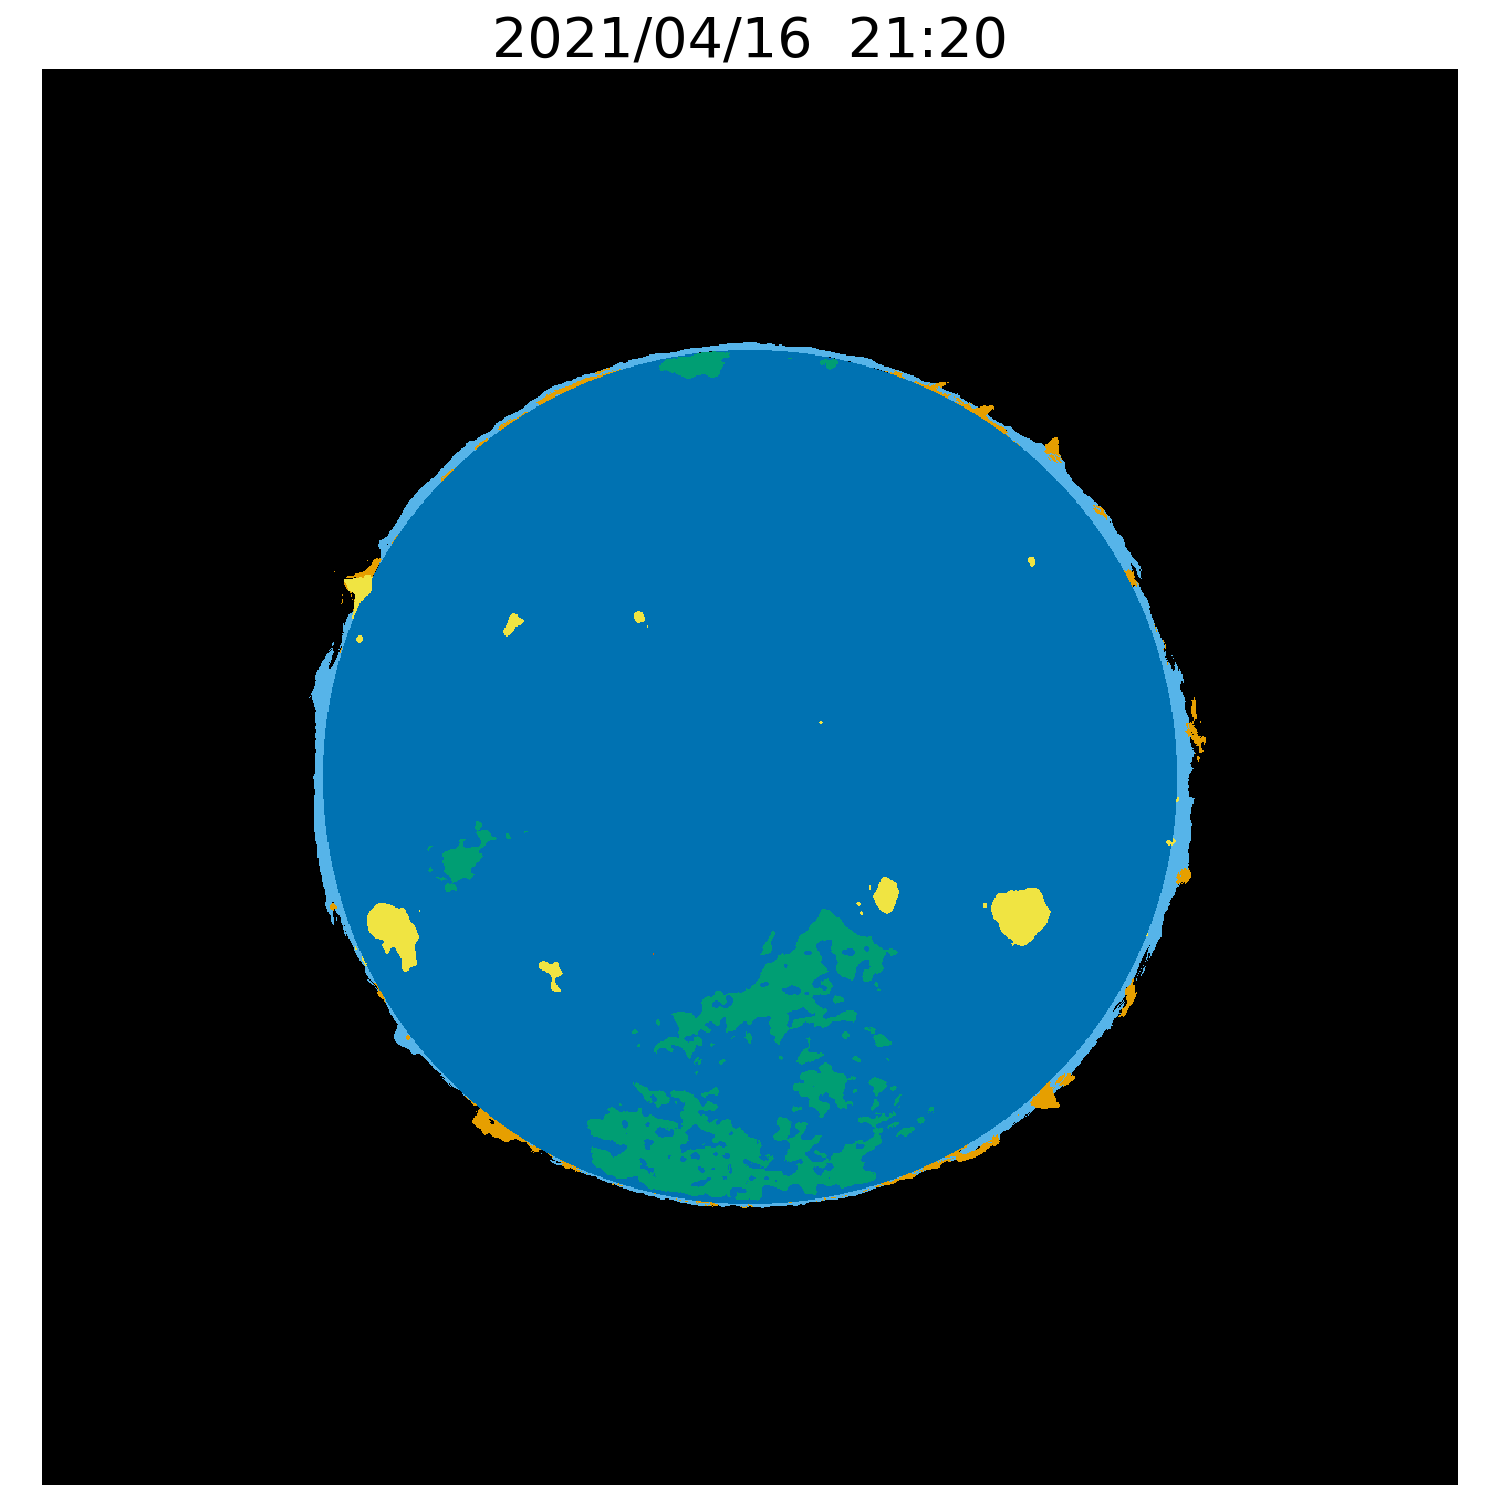
Thematic Map Example
- # Purpose:
Example fits and plot commands for the SUVI thematic map product
# Import modules
import os
import requests
from astropy.io import fits
import matplotlib
import matplotlib.patches as mpatches
import matplotlib.pyplot as plt
from datetime import datetime
# Access thematic map file
dir = './'
file = 'dr_suvi-l2-thmap_g16_s20210416T212000Z_e20210416T212400Z_v1-0-2.fits'

# Download the file if it does not exist locally
if not os.path.exists(os.path.join(dir, file)):
    with open(os.path.join(dir, file), "wb") as f:
        url_path = 'https://data.ngdc.noaa.gov/platforms/solar-space-observing-satellites/goes/goes16/l2/data/' \
                   'suvi-l2-thmap/2021/04/16/'
        r = requests.get(url_path + file)
        f.write(r.content)
Open file and read data
with fits.open(os.path.join(dir, file)) as hdul:
    thmap_data = hdul[0].data
    if 'DATE-OBS' in hdul[0].header.keys():
        thmap_date_str = hdul[0].header['DATE-OBS']
        thmap_date = datetime.strptime(thmap_date_str, "%Y-%m-%dT%H:%M:%S.%f")
    else:
        start_string = file.split("_")[3][1:-1]
        thmap_date = datetime.strptime(start_string, "%Y%m%dT%H%M%S")
Plot thematic map
# Function to plot thematic map
def plot_thematic_map(thmap_data, thmap_date, save=False, save_folder='./'):
    fig = plt.figure(figsize=(15,15))
    plt.axis('off')
    SOLAR_CLASSES = [('unlabeled', 0),
                     ('outer_space', 1),
                     ('bright_region', 3),
                     ('filament', 4),
                     ('prominence', 5),
                     ('coronal_hole', 6),
                     ('quiet_sun', 7),
                     ('limb', 8),
                     ('flare', 9)]
    SOLAR_CLASS_NAME = {number: theme for theme, number in SOLAR_CLASSES}
    SOLAR_COLORS = {"unlabeled": "white",
                    "outer_space": "black",
                    "bright_region": "#F0E442",
                    "filament": "#D55E00",
                    "prominence": "#E69F00",
                    "coronal_hole": "#009E73",
                    "quiet_sun": "#0072B2",
                    "limb": "#56B4E9",
                    "flare": "#CC79A7"}
    colortable = [SOLAR_COLORS[SOLAR_CLASS_NAME[i]] if i in SOLAR_CLASS_NAME else 'white'
                  for i in range(max(list(SOLAR_CLASS_NAME.keys())) + 1)]
    cmap = matplotlib.colors.ListedColormap(colortable)
    legend_handles = [
        mpatches.Patch(color=SOLAR_COLORS[name], label=name.replace('_', ' ').title())
        for name, _ in SOLAR_CLASSES]

    plt.legend(handles = legend_handles, loc='upper center', ncols = len(SOLAR_CLASSES))

    plt.imshow(thmap_data, origin='lower', cmap=cmap, vmin=-1, vmax=len(colortable), interpolation='none')
    plt.axis('off')
    plt.margins(0, 0)
    plt.title(thmap_date.strftime("%Y/%m/%d  %H:%M"), fontsize=40)
    fig.tight_layout()
    if save:
        fig.savefig(save_folder + 'thematic_map' + thmap_date.strftime("%Y%m%dT%H%M%S") + '.png', bbox_inches='tight')
# Plot the thematic map without saving
plot_thematic_map(thmap_data, thmap_date)
# Plot and save the thematic map
save_folder = './'
plot_thematic_map(thmap_data, thmap_date, save=True, save_folder=save_folder)

Total running time of the script: (0 minutes 2.065 seconds)