Note
Go to the end to download the full example code.
Reading and plotting SEISS data
- Purpose:
Python example of netcdf and plot commands for use with GOES-R SEISS files
Import modules
import netCDF4 as nc
import numpy as np
import cftime
import os, sys
import requests
import matplotlib.pyplot as plt
Relevant data files can be downloaded here. To run this code, it may be necessary to update the filename version string (“v2-1-0”) to match available files.
Other data links and information about EXIS data can be found here
dir0 = "./"
file0 = "sci_mpsh-l2-avg1m_g16_d20200601_v1-0-2.nc"

# Download `file0` if it does not exist locally
if not os.path.exists(dir0 + file0):
    with open(dir0 + file0, "wb") as f:
        url = f"https://data.ngdc.noaa.gov/platforms/solar-space-observing-satellites/goes/goes16/l2/data/mpsh-l2-avg1m/2020/06/{file0}"
        print('downloading: ', url)
        r = requests.get(url)
        f.write(r.content)
Open netcdf file for reading data
ds = nc.Dataset(dir0 + file0)
Time conversion
times = cftime.num2pydate(ds.variables["L2_SciData_TimeStamp"][:], ds["L2_SciData_TimeStamp"].units)
print("Filename:  ", file0)
print("start and end times:", times[0], times[-1])
Filename:   sci_mpsh-l2-avg1m_g16_d20200601_v1-0-2.nc
start and end times: 2020-06-01 00:00:00 2020-06-01 23:59:00
Print all variable names
print("\nAll variable names: ")
print(list(ds.variables.keys()), "\n")
All variable names:
['L2_SciData_TimeStamp', 'L1bRecordsInAvg', 'YawFlipFlag', 'EclipseFlag', 'AvgDiffProtonFlux', 'AvgDiffProtonFluxUncert', 'DiffProtonValidL1bSamplesInAvg', 'DiffProtonDQFdtcSum', 'DiffProtonDQFoobSum', 'DiffProtonDQFerrSum', 'AvgDiffElectronFlux', 'AvgDiffElectronFluxUncert', 'DiffElectronEffectiveEnergy', 'DiffElectronValidL1bSamplesInAvg', 'DiffElectronDQFdtcSum', 'DiffElectronDQFoobSum', 'DiffElectronDQFerrSum', 'AvgIntElectronFlux', 'AvgIntElectronFluxUncert', 'IntElectronEffectiveEnergy', 'IntValidL1bSamplesInAvg', 'IntDQFdtcSum', 'IntDQFoobSum', 'IntDQFerrSum', 'DiffProtonLowerEnergy', 'DiffProtonUpperEnergy', 'DiffProtonEffectiveEnergy', 'ExpectedLUTNotFound']
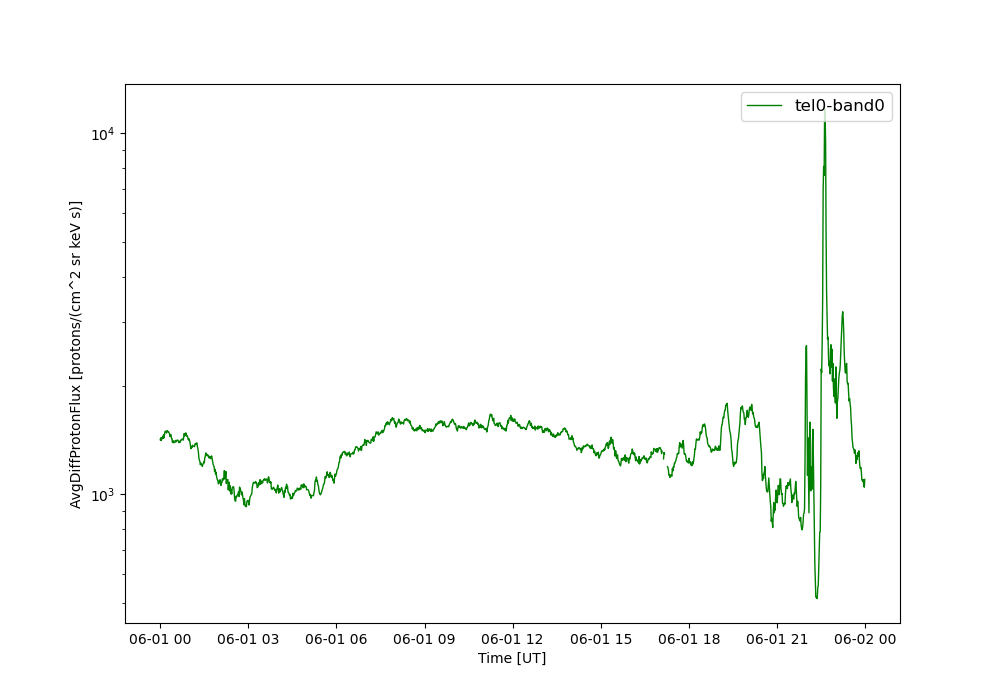
Plot 1 day of MPSH 1-minute AvgDiffProtonFlux in Telescope 0, Band 0
var = 'AvgDiffProtonFlux'
tel = 0
band = 0
data = []
for i in range(0, len(times)):
    data.append(ds.variables[var][i][tel][band])
plt.figure(0, figsize=[10, 7])
plt.plot(
    times[:],
    data,
    linewidth=1,
    color="green",
    label=f"tel{tel}-band{band}",
)
plt.yscale("log")
plt.legend(loc="upper right", prop={"size": 12})
plt.xlabel("Time [UT]")
plt.ylabel(f"{var} [{ds[var].units}]")
plt.show()
print("Done.\n")
/home/runner/micromamba/envs/goesr-spwx-examples/lib/python3.12/site-packages/numpy/_core/shape_base.py:61: UserWarning: Warning: converting a masked element to nan.
  result = asanyarray(arys[0])
Done.
Total running time of the script: (0 minutes 0.614 seconds)